
%20--%3e%3cpath%20d='M2025.4,806.8c-2.5,20.1-16.2,38.2-34.5,45.1-3.4,1.3-8.4,2.3-14.6,3.2-14.2,1.9-34.3,2.8-53.7,2.7h-.2c-23.1-.1-45.1-1.7-54.4-4.4-2.5-.7-4.9-1.6-7.2-2.7-.2,0-.3-.2-.5-.2-8.2-3.8-15.6-9.8-21.1-17.1-5.7-7.6-9.4-16.8-10-27,0,0,0,0,0,0-.5-3.1-.8-6.3-1.1-9.7-.5-7.2-.9-16.4-1-26.5h281.9c0-63.9-2.2-130.2-61.1-167.8-37.4-23.8-95.6-24.8-152.9-22.2-52.8,2.3-90.5,17.6-115.3,46.6-24.2,28.3-35.5,68.9-34.5,125.8h0c.2,12.6,1,26,2.4,40.2.3,3.1.6,6.2,1,9.4,2.9,25.9,12.9,50.3,28.9,70.4,10.9,13.8,24,24.9,38.8,32.8,7.6,4.1,15.7,7.4,24.1,9.8,17.8,5,52.5,7.8,87.8,7.8s64.2-2.2,84.5-7.1c2.9-.7,5.5-1.4,7.8-2.2,45-15,82.5-60.5,85.6-106.7h-80.6ZM2025.3,709.9h-198.3v-2.6c0-33.2,26.7-58.2,64.8-58.2h72.8c30.3,0,60.8,24.9,60.8,58.2v2.6Z'/%3e%3cpath%20d='M1620.8,806.8c-2.5,20.1-16.2,38.2-34.5,45.1-3.4,1.3-8.4,2.3-14.6,3.2-14.2,1.9-34.3,2.8-53.7,2.7h-.2c-23.1-.1-45.1-1.7-54.4-4.4-2.5-.7-4.9-1.6-7.2-2.7-.2,0-.3-.2-.5-.2-8.2-3.8-15.6-9.8-21.1-17.1-5.7-7.6-9.4-16.8-10-27,0,0,0,0,0,0-.5-3.1-.8-6.3-1.1-9.7-.5-7.2-.9-16.4-1-26.5h281.9c0-63.9-2.2-130.2-61.1-167.8-37.4-23.8-95.6-24.8-152.9-22.2-52.8,2.3-90.5,17.6-115.3,46.6-24.2,28.3-35.5,68.9-34.5,125.8h0c.2,12.6,1,26,2.4,40.2.3,3.1.6,6.2,1,9.4,2.9,25.9,12.9,50.3,28.9,70.4,10.9,13.8,24,24.9,38.8,32.8,7.6,4.1,15.7,7.4,24.1,9.8,17.8,5,52.5,7.8,87.8,7.8s64.2-2.2,84.5-7.1c2.9-.7,5.5-1.4,7.8-2.2,45-15,82.5-60.5,85.6-106.7h-80.6ZM1620.8,709.9h-198.3v-2.6c0-33.2,26.7-58.2,64.8-58.2h72.8c30.3,0,60.8,24.9,60.8,58.2v2.6Z'/%3e%3cpath%20d='M2968.1,806.8c-2.5,20.1-16.2,38.2-34.5,45.1-3.4,1.3-8.4,2.3-14.6,3.2-14.2,1.9-34.3,2.8-53.7,2.7h-.2c-23.1-.1-45.1-1.7-54.4-4.4-2.5-.7-4.9-1.6-7.2-2.7-.2,0-.3-.2-.5-.2-8.2-3.8-15.6-9.8-21.1-17.1-5.7-7.6-9.4-16.8-10-27,0,0,0,0,0,0-.5-3.1-.8-6.3-1.1-9.7-.5-7.2-.9-16.4-1-26.5h281.9c0-63.9-2.2-130.2-61.1-167.8-37.4-23.8-95.6-24.8-152.9-22.2-52.8,2.3-90.5,17.6-115.3,46.6-24.2,28.3-35.5,68.9-34.5,125.8h0c.2,12.6,1,26,2.4,40.2.3,3.1.6,6.2,1,9.4,2.9,25.9,12.9,50.3,28.9,70.4,10.9,13.8,24,24.9,38.8,32.8,7.6,4.1,15.7,7.4,24.1,9.8,17.8,5,52.5,7.8,87.8,7.8s64.2-2.2,84.5-7.1c2.9-.7,5.5-1.4,7.8-2.2,45-15,82.5-60.5,85.6-106.7h-80.6ZM2968,709.9h-198.3v-2.6c0-33.2,26.7-58.2,64.8-58.2h72.8c30.3,0,60.8,24.9,60.8,58.2v2.6Z'/%3e%3cpath%20d='M2402,586.8c-33.3-9.5-98.1-9.6-133.7-3.3-28.1,4.9-55.3,19.7-76.7,41.5-21.4,21.8-35.7,49.3-40.3,77.5-10.8,65.9,0,123.9,30.3,163.2,24.8,32.1,61.3,50.7,108.4,55.2,14.2,1.3,27.5,2,40.1,2,30.6,0,56.9-4,79.6-12,39.8-14,69.4-40,86-79.2,8.9-20.9,11.3-36.7,11.3-59.5v-1h-78.2s1.1,63.5-43.7,75.9c-26.4,6.3-75.2,4-98.6,2.3-17.8-1.3-31.6-7.1-41-17.3-9-9.8-14.2-24-15.4-42.1-1.9-28.8-2.6-90.3,7.3-109.2,7.1-13.5,21.4-23.8,37.3-27,23-4.5,98.1-4.2,117.7,3.4,37.1,14.4,36.3,55.9,36.3,55.9h78.2v-2c0-26.6-10.5-55.1-31.4-78.7-19.5-21.9-47-37.8-73.7-45.4Z'/%3e%3crect%20x='2557.8'%20y='492.7'%20width='80.1'%20height='422.1'/%3e%3cpolygon%20points='1119.3%20831.5%201007.4%20585.6%20913.1%20585.6%201065%20913.6%201065.5%20914.8%201173%20914.8%201325.4%20585.6%201231.2%20585.6%201119.3%20831.5'/%3e%3cpolygon%20points='265%20601.6%20265%20810.4%20627.6%201019.1%20627.6%201019.1%20627.6%201019.1%20627.6%201019.1%20627.6%201019.1%20808.9%20914.8%20808.9%20706%20627.6%20810.4%20265%20601.6'/%3e%3cpolygon%20points='808.9%20706%20808.9%20497.2%20627.6%20601.5%20808.9%20706'/%3e%3c/svg%3e)
RTOS trace in a simulator: the format was never the hard part

I wanted a scheduler timeline out of a simulated board. No probe, no bench, just a run in CI that tells me which thread held the CPU and when it gave it up.
The tracing format turned out to be the easy part. The pipe the bytes come out of is where the whole thing lives or dies, and that is the part nobody writes about.
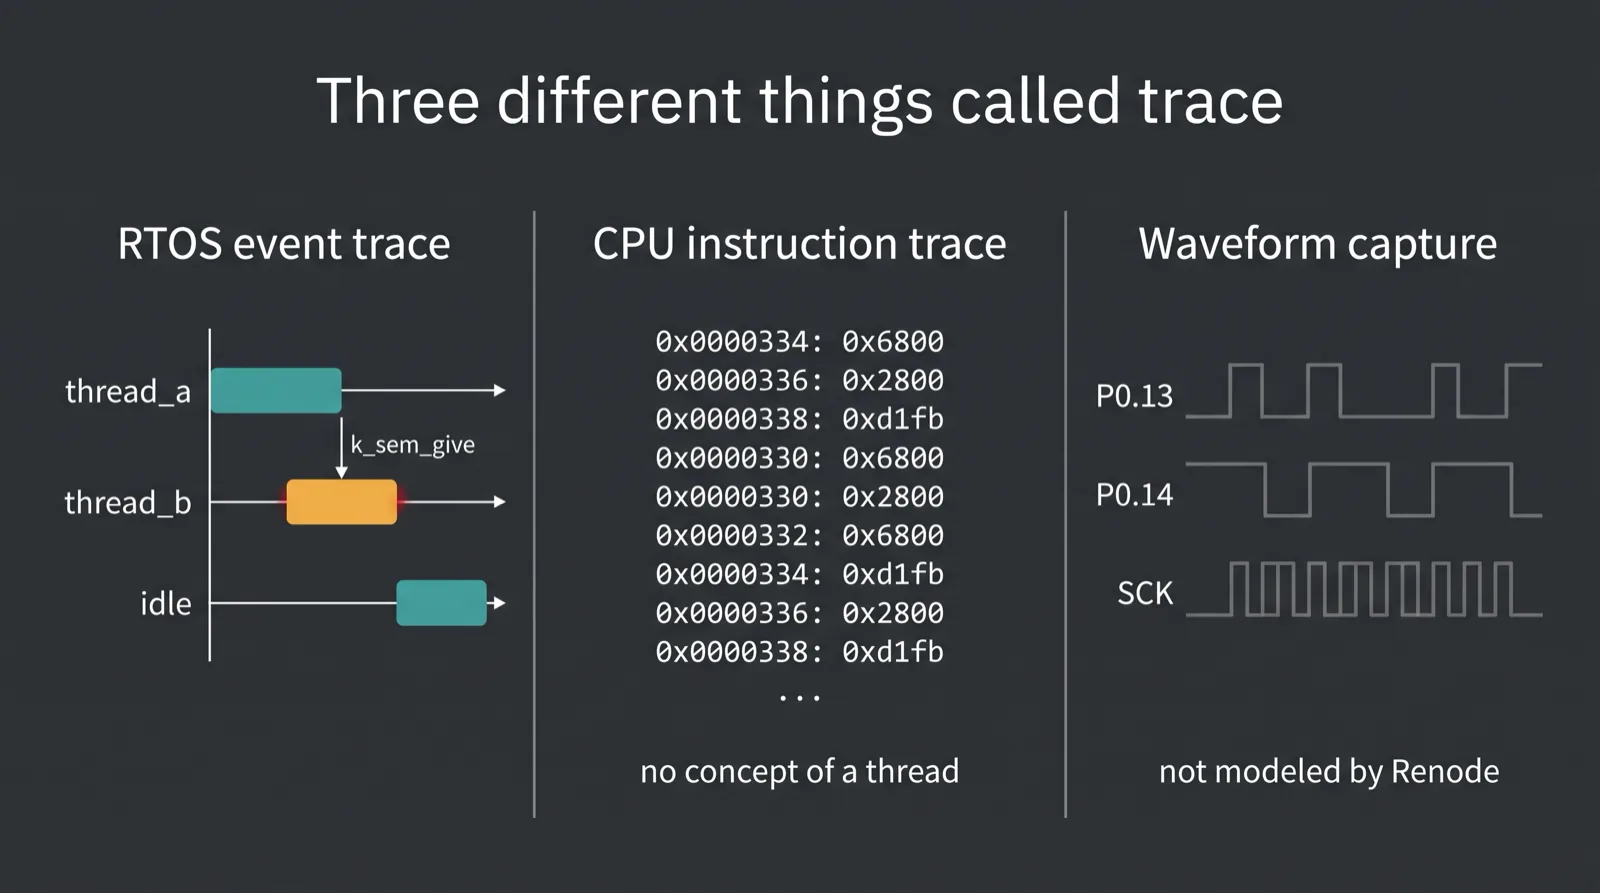
Three unrelated things are called "trace"
RTOS event trace is the kernel telling you about itself. Zephyr's hooks fire on thread switches, semaphore operations, ISR entry and exit, and the format layer serializes each one into an event. This is the only one of the three that knows what a thread is.
CPU instruction trace is the simulator recording what the core executed.
Renode does this with cpu CreateExecutionTracing, in PC, Opcode,
PCAndOpcode or Disassembly mode, and the output feeds coverage tooling.1
It is a superb receipt for which lines ran. It has no idea that a scheduler
exists, because a context switch is just more instructions.
Waveform capture is pin state over time, the thing a logic analyzer draws. Renode does not have it. A GPIO logic analyzer view has been an open feature request since June 2023.2
Three different questions. Teams conflate them constantly, then get frustrated that the tool they picked cannot answer the question they actually had.
Tracealyzer and SystemView are wired to a debug probe
Search tracealyzer renode and you find people trying to point a commercial
RTOS visualizer at a simulated machine. The obstacle is transport.
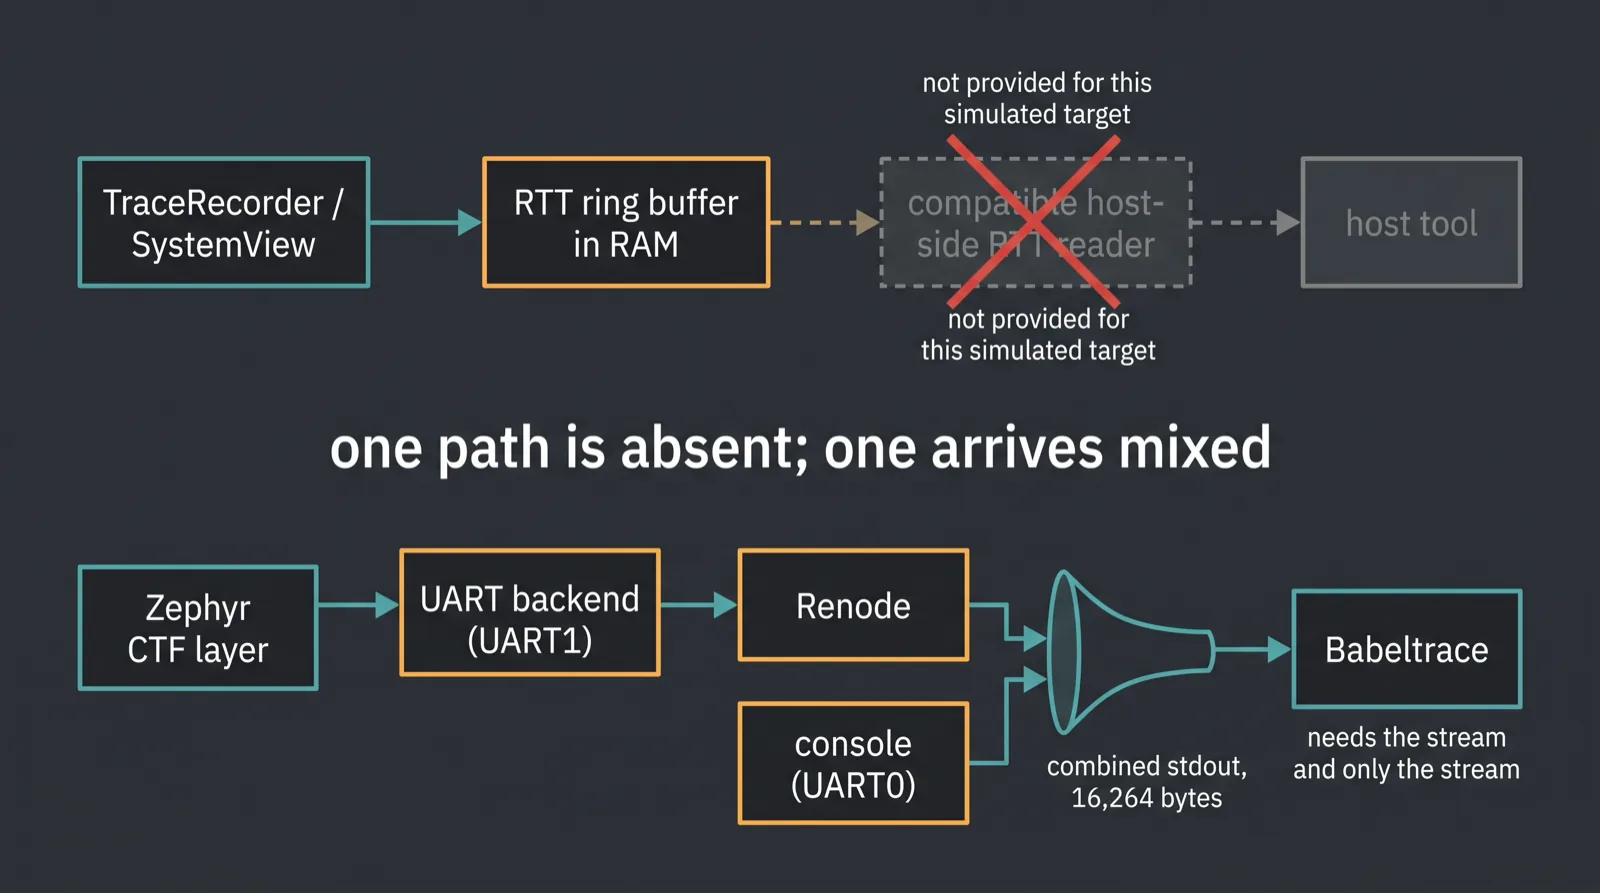
Percepio's TraceRecorder ships as a Zephyr module, and the stream ports exposed in Zephyr's configuration system are Ring Buffer, RTT, ITM and Semihost.34 Ring Buffer means you dump RAM from a debugger. RTT means a host-side reader polls a control block in target RAM, commonly through J-Link tooling. ITM means the Cortex-M trace unit and a fast probe on SWO. Semihost writes a host file and is scoped to QEMU. There is no UART stream port in that list.
SEGGER SystemView is blunter still. Zephyr's own documentation says the payload "relies on RTT as a transport", and that newer SystemView versions support other transports such as UART or snapshot mode, both "still not supported in Zephyr".5 SEGGER shipped UART and TCP/IP acquisition in SystemView V3.10 in December 2019.6 The host tool has had a serial recorder for over six years. The Zephyr integration still asks for the probe.
That is the crux for anyone running without hardware. Delete the probe and something still has to poll the RTT control block while the core runs. Neither integration ships that compatible host-side reader for a simulated target.
Zephyr's own CTF format does speak UART
The in-tree path avoids the problem entirely. Zephyr's Common Trace Format layer is transport-agnostic, and the supported backends are UART, USB, File on the POSIX targets, RTT, and RAM.5 The tracing sample carries a config for exactly this combination:
CONFIG_TRACING=y
CONFIG_TRACING_CTF=y
CONFIG_TRACING_BACKEND_UART=y
CONFIG_TRACING_BUFFER_SIZE=4096
That is prj_uart_ctf.conf, verbatim, from the sample in Zephyr 4.4.1.7 The
sample README adds the detail that decides whether any of this works: you set
the zephyr,tracing-uart property under the devicetree chosen node, which is
how you keep trace bytes off the console UART.8 Decoding is Babeltrace or
TraceCompass pointed at a directory holding the CTF metadata file next to the
captured channel.
No probe, no vendor license, no RTT. On paper this is the simulator-friendly option, so I ran it.
What actually came back
Zephyr 4.4.1, the tracing sample built for the nRF52840 DK with
prj_uart_ctf.conf, trace backend bound to UART1 so the console could keep
UART0. Chiplab ran it on Renode 1.16.1 for a bounded simulation window.
The run produced exactly one artifact: combined stdout.
$ python3 -c "b=open('stdout.bin','rb').read(); \
print(len(b), sum(1 for c in b if c < 9 or 13 < c < 32 or c > 126))"
16264 3750

$ strings -n 4 stdout.bin | grep -E 'thread_a|thread_b|idle|tracing_thread' | sort -u
idle
thread_a
thread_b
tracing_thread
Sixteen kilobytes, of which 3,750 bytes fall outside printable ASCII. Those are
UART1 binary fragments, interleaved with console text in one stream. The visible
strings are the giveaway that this is real trace payload rather than log output:
thread_a is the K_THREAD_DEFINE name, thread_b is set by
k_thread_name_set in the sample's own source,9 and tracing_thread is the
tracing subsystem's worker, named the same way in the tracing core.10 Those
names ride in CTF thread events. The sample's printk lines say "Hello World
from" and look nothing like that.
Enough of the chain held to put trace-shaped payload into capture. Hooks compiled in, the UART backend transmitted binary data, and trace-specific thread names survived. Without a successful decode, I cannot claim that a complete valid CTF stream survived intact.
What I do not have is a clean channel file. The trace reached capture mixed into combined stdout rather than delivered as a separate decoder-ready UART stream, and I am not going to fabricate a Babeltrace session I never ran. Partial result, reported as partial.
A clean UART stream is necessary, not sufficient
This is the part worth internalizing before you blame the emulator. A CTF decoder wants the stream and nothing but the stream. Anything else in the byte sequence is an event header as far as the parser is concerned.
Zephyr issue 49889 shows the next wall on a physical reel_board with a real
serial cable. The reporter commented out every printk in main.c so only
trace data would go down the UART, captured with the in-tree
trace_capture_uart.py, then ran a second capture specifically to dodge the
boot banner. Babeltrace 1.5.8 still answered [error] Event id 32 is unknown,
and Babeltrace 2 produced the structured equivalent.11 No simulator was
involved anywhere in that report. Separating the streams removes one source of
corruption; it does not guarantee that the remaining bytes decode.
The Renode side of the same class shows up in issue 699, where semihosting UART output simply never appeared on the analyzer the user was watching.12 Getting a second byte stream out of a simulated machine, into its own file, is configuration work that nobody's quickstart covers, because every quickstart assumes one console and one human reading it.
The fix is unglamorous and entirely mechanical: bind each UART to its own sink, keep console and trace separated from the peripheral all the way to disk, then decode. That is the next run, and it is a plumbing change, not a tracing change.
Why this matters more for agents than for humans
A human debugging with a board on the desk works around a contaminated stream without noticing. Squint at the console, ignore the garbage, move on.
An agent cannot. It gets an artifact, and the artifact either parses into events or it does not. "Mostly the right bytes, in the wrong container" is worthless to a machine reader and looks identical to success from the outside, which is the failure mode I care about most. The run exits zero. Something got captured. Only a decode attempt tells you whether observability actually happened.
That is the same line I keep drawing between what simulation proves and what it merely runs. Instruction trace and event trace both come free of hardware, and neither covers what simulation still cannot catch. Deciding which of these belongs in a pipeline at all is the argument in simulation versus hardware in the loop, and the habit of checking a tool's claims against its own issue tracker is the one from the simulator comparison audit.
Trace was supposed to be the observability story for firmware without hardware. It half is. The formats are open, the hooks are upstream, the decoders are free. The transport is where six years of a shipped UART recorder still has not reached the integration, and where a working RTOS trace turns into a file no decoder will read.
Sources
Footnotes
-
Renode documentation, "Execution tracing." https://renode.readthedocs.io/en/latest/execution-tracing/execution-tracing.html ↩
-
Renode issue #478, "GPIO logic analyzer view," opened 2023-06-21, still open. https://github.com/renode/renode/issues/478 ↩
-
Percepio, "Getting Started with TraceRecorder on Zephyr." https://percepio.com/getstarted/latest/html/zephyr.html ↩
-
Zephyr documentation, "Percepio TraceRecorder and Stream Ports" (stream port list stated as of July 2024). https://docs.zephyrproject.org/latest/services/tracing/index.html ↩
-
Zephyr documentation, "Tracing" — SEGGER SystemView support and Transport Backends. https://docs.zephyrproject.org/latest/services/tracing/index.html ↩ ↩2
-
SEGGER, "SystemView adds data acquisition via UART and TCP/IP," 2019-12-18. https://www.segger.com/news/seggers-systemview-adds-data-acquisition-via-uart-and-tcpip/ ↩
-
Zephyr v4.4.1,
samples/subsys/tracing/prj_uart_ctf.conf. https://github.com/zephyrproject-rtos/zephyr/blob/v4.4.1/samples/subsys/tracing/prj_uart_ctf.conf ↩ -
Zephyr v4.4.1,
samples/subsys/tracing/README.rst. https://github.com/zephyrproject-rtos/zephyr/blob/v4.4.1/samples/subsys/tracing/README.rst ↩ -
Zephyr v4.4.1,
samples/subsys/tracing/src/main.c. https://github.com/zephyrproject-rtos/zephyr/blob/v4.4.1/samples/subsys/tracing/src/main.c ↩ -
Zephyr v4.4.1,
subsys/tracing/tracing_core.c(worker thread namedtracing_threadviak_thread_name_set). https://github.com/zephyrproject-rtos/zephyr/blob/v4.4.1/subsys/tracing/tracing_core.c ↩ -
Zephyr issue #49889, "ctf trace: unknown event id when parsing samples/tracing result on reel board," opened 2022-09-04. https://github.com/zephyrproject-rtos/zephyr/issues/49889 ↩
-
Renode issue #699, "Access semihosting UART from Rust," opened 2024-11-13. https://github.com/renode/renode/issues/699 ↩