
%20--%3e%3cpath%20d='M2025.4,806.8c-2.5,20.1-16.2,38.2-34.5,45.1-3.4,1.3-8.4,2.3-14.6,3.2-14.2,1.9-34.3,2.8-53.7,2.7h-.2c-23.1-.1-45.1-1.7-54.4-4.4-2.5-.7-4.9-1.6-7.2-2.7-.2,0-.3-.2-.5-.2-8.2-3.8-15.6-9.8-21.1-17.1-5.7-7.6-9.4-16.8-10-27,0,0,0,0,0,0-.5-3.1-.8-6.3-1.1-9.7-.5-7.2-.9-16.4-1-26.5h281.9c0-63.9-2.2-130.2-61.1-167.8-37.4-23.8-95.6-24.8-152.9-22.2-52.8,2.3-90.5,17.6-115.3,46.6-24.2,28.3-35.5,68.9-34.5,125.8h0c.2,12.6,1,26,2.4,40.2.3,3.1.6,6.2,1,9.4,2.9,25.9,12.9,50.3,28.9,70.4,10.9,13.8,24,24.9,38.8,32.8,7.6,4.1,15.7,7.4,24.1,9.8,17.8,5,52.5,7.8,87.8,7.8s64.2-2.2,84.5-7.1c2.9-.7,5.5-1.4,7.8-2.2,45-15,82.5-60.5,85.6-106.7h-80.6ZM2025.3,709.9h-198.3v-2.6c0-33.2,26.7-58.2,64.8-58.2h72.8c30.3,0,60.8,24.9,60.8,58.2v2.6Z'/%3e%3cpath%20d='M1620.8,806.8c-2.5,20.1-16.2,38.2-34.5,45.1-3.4,1.3-8.4,2.3-14.6,3.2-14.2,1.9-34.3,2.8-53.7,2.7h-.2c-23.1-.1-45.1-1.7-54.4-4.4-2.5-.7-4.9-1.6-7.2-2.7-.2,0-.3-.2-.5-.2-8.2-3.8-15.6-9.8-21.1-17.1-5.7-7.6-9.4-16.8-10-27,0,0,0,0,0,0-.5-3.1-.8-6.3-1.1-9.7-.5-7.2-.9-16.4-1-26.5h281.9c0-63.9-2.2-130.2-61.1-167.8-37.4-23.8-95.6-24.8-152.9-22.2-52.8,2.3-90.5,17.6-115.3,46.6-24.2,28.3-35.5,68.9-34.5,125.8h0c.2,12.6,1,26,2.4,40.2.3,3.1.6,6.2,1,9.4,2.9,25.9,12.9,50.3,28.9,70.4,10.9,13.8,24,24.9,38.8,32.8,7.6,4.1,15.7,7.4,24.1,9.8,17.8,5,52.5,7.8,87.8,7.8s64.2-2.2,84.5-7.1c2.9-.7,5.5-1.4,7.8-2.2,45-15,82.5-60.5,85.6-106.7h-80.6ZM1620.8,709.9h-198.3v-2.6c0-33.2,26.7-58.2,64.8-58.2h72.8c30.3,0,60.8,24.9,60.8,58.2v2.6Z'/%3e%3cpath%20d='M2968.1,806.8c-2.5,20.1-16.2,38.2-34.5,45.1-3.4,1.3-8.4,2.3-14.6,3.2-14.2,1.9-34.3,2.8-53.7,2.7h-.2c-23.1-.1-45.1-1.7-54.4-4.4-2.5-.7-4.9-1.6-7.2-2.7-.2,0-.3-.2-.5-.2-8.2-3.8-15.6-9.8-21.1-17.1-5.7-7.6-9.4-16.8-10-27,0,0,0,0,0,0-.5-3.1-.8-6.3-1.1-9.7-.5-7.2-.9-16.4-1-26.5h281.9c0-63.9-2.2-130.2-61.1-167.8-37.4-23.8-95.6-24.8-152.9-22.2-52.8,2.3-90.5,17.6-115.3,46.6-24.2,28.3-35.5,68.9-34.5,125.8h0c.2,12.6,1,26,2.4,40.2.3,3.1.6,6.2,1,9.4,2.9,25.9,12.9,50.3,28.9,70.4,10.9,13.8,24,24.9,38.8,32.8,7.6,4.1,15.7,7.4,24.1,9.8,17.8,5,52.5,7.8,87.8,7.8s64.2-2.2,84.5-7.1c2.9-.7,5.5-1.4,7.8-2.2,45-15,82.5-60.5,85.6-106.7h-80.6ZM2968,709.9h-198.3v-2.6c0-33.2,26.7-58.2,64.8-58.2h72.8c30.3,0,60.8,24.9,60.8,58.2v2.6Z'/%3e%3cpath%20d='M2402,586.8c-33.3-9.5-98.1-9.6-133.7-3.3-28.1,4.9-55.3,19.7-76.7,41.5-21.4,21.8-35.7,49.3-40.3,77.5-10.8,65.9,0,123.9,30.3,163.2,24.8,32.1,61.3,50.7,108.4,55.2,14.2,1.3,27.5,2,40.1,2,30.6,0,56.9-4,79.6-12,39.8-14,69.4-40,86-79.2,8.9-20.9,11.3-36.7,11.3-59.5v-1h-78.2s1.1,63.5-43.7,75.9c-26.4,6.3-75.2,4-98.6,2.3-17.8-1.3-31.6-7.1-41-17.3-9-9.8-14.2-24-15.4-42.1-1.9-28.8-2.6-90.3,7.3-109.2,7.1-13.5,21.4-23.8,37.3-27,23-4.5,98.1-4.2,117.7,3.4,37.1,14.4,36.3,55.9,36.3,55.9h78.2v-2c0-26.6-10.5-55.1-31.4-78.7-19.5-21.9-47-37.8-73.7-45.4Z'/%3e%3crect%20x='2557.8'%20y='492.7'%20width='80.1'%20height='422.1'/%3e%3cpolygon%20points='1119.3%20831.5%201007.4%20585.6%20913.1%20585.6%201065%20913.6%201065.5%20914.8%201173%20914.8%201325.4%20585.6%201231.2%20585.6%201119.3%20831.5'/%3e%3cpolygon%20points='265%20601.6%20265%20810.4%20627.6%201019.1%20627.6%201019.1%20627.6%201019.1%20627.6%201019.1%20627.6%201019.1%20808.9%20914.8%20808.9%20706%20627.6%20810.4%20265%20601.6'/%3e%3cpolygon%20points='808.9%20706%20808.9%20497.2%20627.6%20601.5%20808.9%20706'/%3e%3c/svg%3e)
A firmware instruction trace is not code coverage

Renode will dump every instruction your firmware executed. People see that file and conclude they have code coverage. They do not.
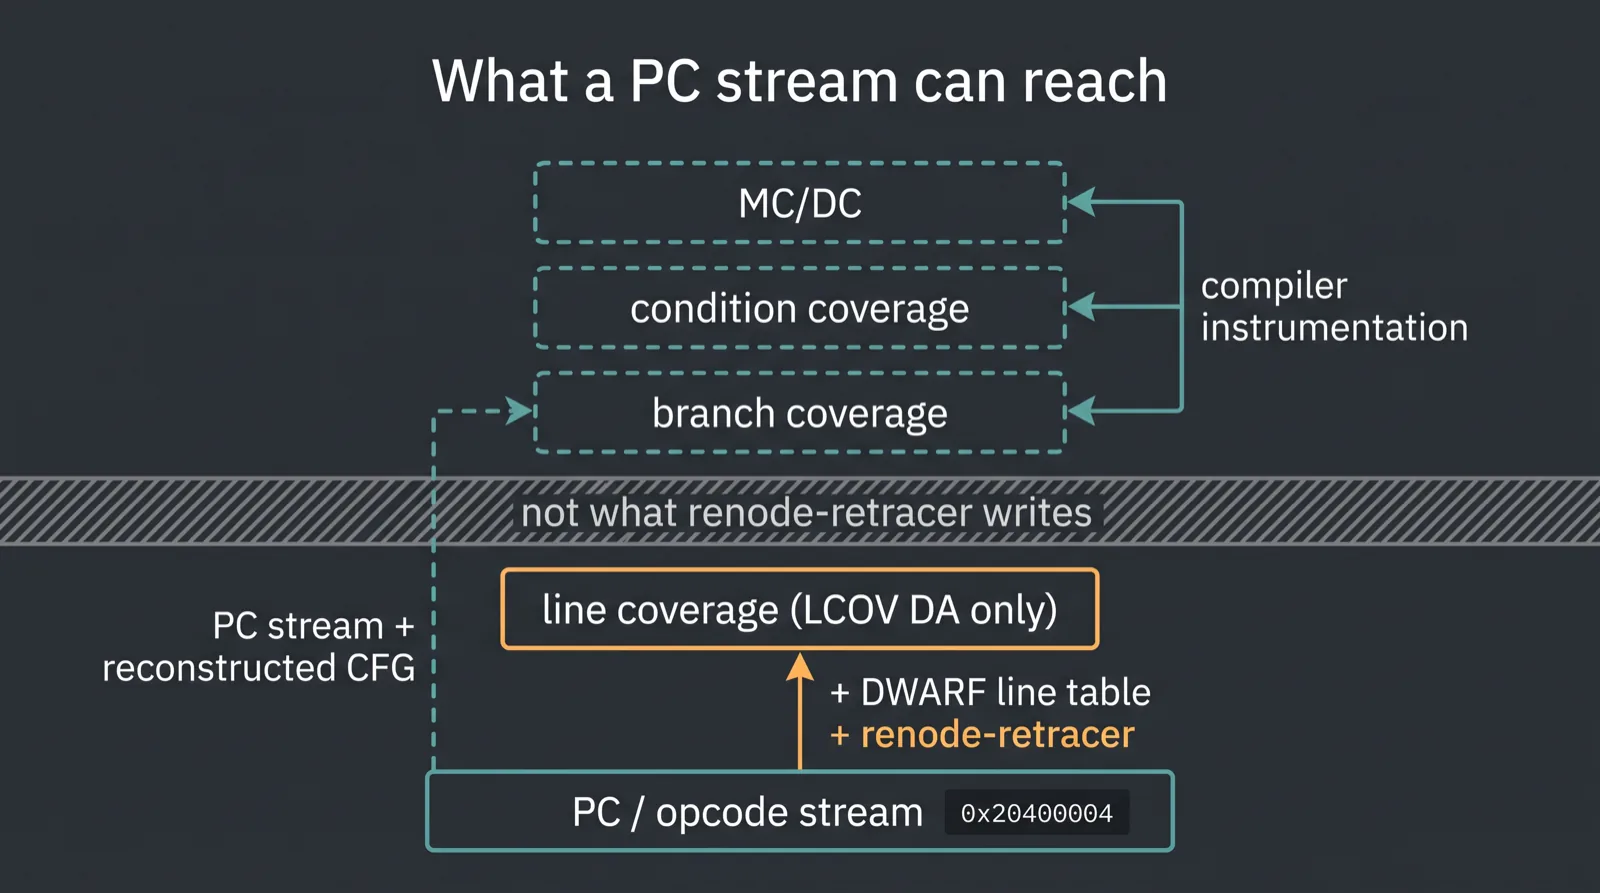
The gap is not a formatting problem. A firmware instruction trace is a list of addresses the core visited. Coverage is a statement about source structure. Getting from the first to the second needs a debug build, a separate post-processing tool, and a DWARF join. Even then, you get line coverage. That is what the tool actually ships. Branch coverage needs a control-flow graph this tool does not build; condition coverage and MC/DC need information a program counter stream never contains at all.
I already split the three unrelated things called trace in RTOS trace in a simulator. This post stays inside the middle one, CPU instruction trace, and asks what that artifact is evidence of.
What is in the file
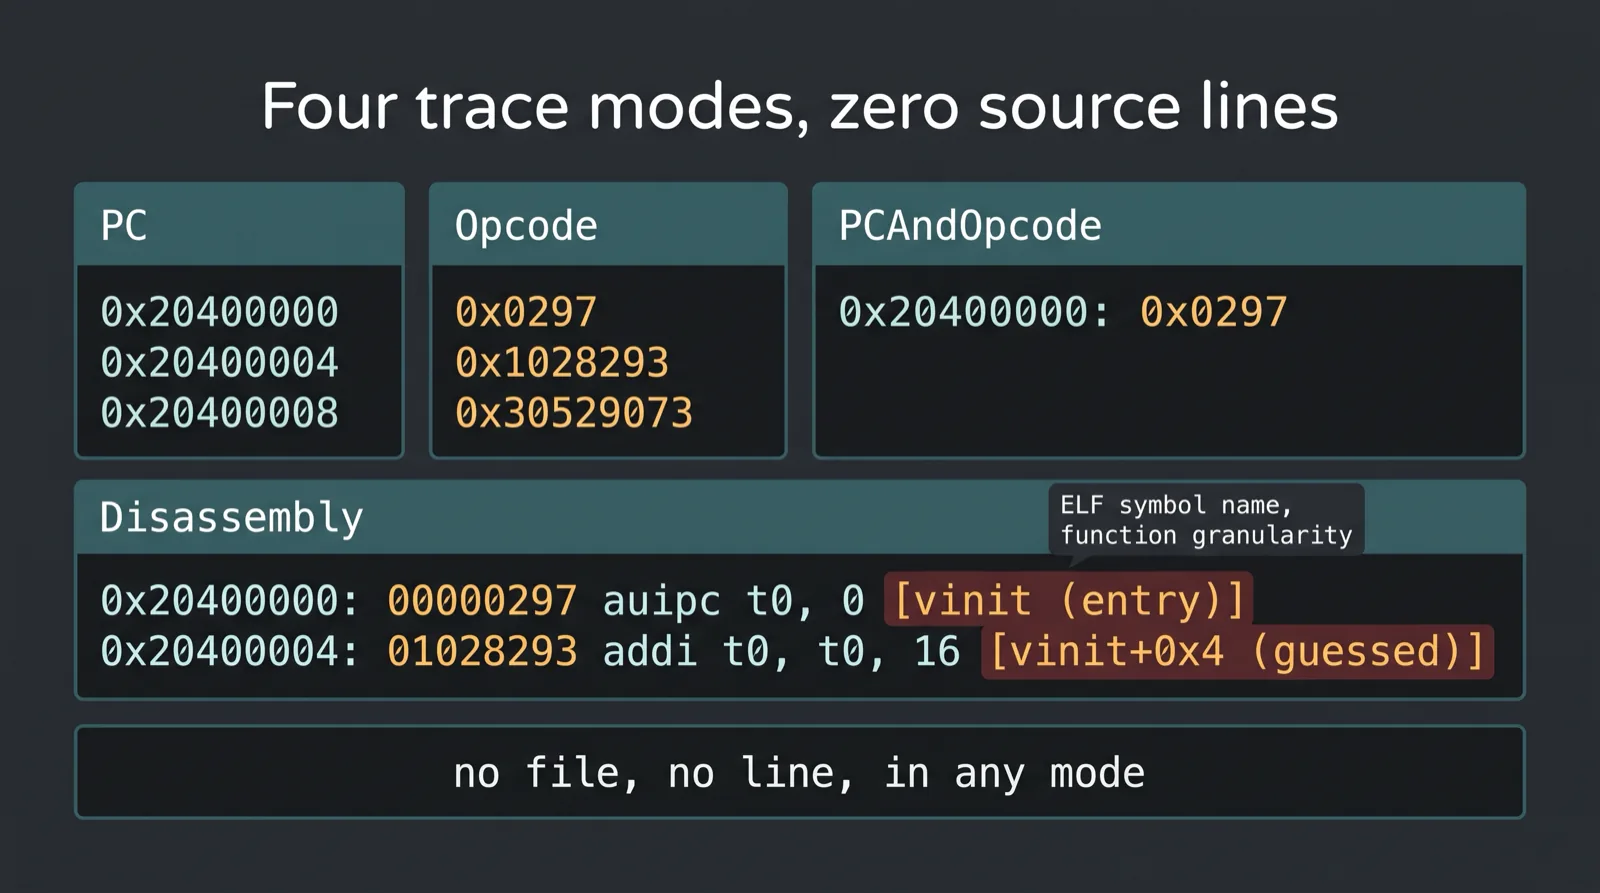
Renode's execution tracing has four modes, selected on the command that turns it
on: cpu CreateExecutionTracing "tracer_name" @path-to-file <mode>, where mode
is PC, Opcode, PCAndOpcode or Disassembly.1 Output can go out binary
or gzipped. cpu DisableExecutionTracing turns it off.
PC mode gives you addresses and nothing else:
0x20400000
0x20400004
0x20400008
Opcode mode gives you the opposite half, raw opcodes with no addresses:
0x0297
0x1028293
0x30529073
PCAndOpcode pairs them:
0x20400000: 0x0297
Disassembly is the only mode that adds anything a human can read, and it comes
from Renode's own built-in LLVM-based disassembler:
0x20400000: 00000297 auipc t0, 0 [vinit (entry)]
0x20400004: 01028293 addi t0, t0, 16 [vinit+0x4 (guessed)]
The brackets are the tell. [vinit (entry)] and [vinit+0x4 (guessed)] are symbol-name guesses pulled from the ELF symbol table. Function
granularity, with the word "guessed" printed in the output where the tool is
interpolating. No file. No line. Not in the richest of the four modes.
That is the whole payload. Renode does not do source-line mapping, and the docs do not pretend otherwise: they hand that job to a separate downstream tool.
The conflation, dated and quoted
This is not a hypothetical mistake. Renode issue 266 was opened on 2021-11-18 with a reasonable question: "i just curious about when testing with renode using Robot Framework, renode can measure code coverage or not... so, i think renode can do this, it will be really great!!!"2
A maintainer answered honestly: "Tracking execution is something that can be easily done with Renode, but with the abundance of coverage tools out there it's difficult to select just one." Then a contributor pointed at the thing that had just landed: "we added the execution tracer module that can dump executed PCs / opcodes to a separate file."
That exchange is the entire problem in four messages. Someone asks for coverage. The available answer is a PC dump. The reporter's follow-up, "that's a good update. how can i use this from robot test framework?", is the sound of a gap being papered over. The issue got closed, then reopened later by a different person asking the obvious next thing: "how can we get an lcov coverage report from the trace?"
In 2021 that question had no documented answer. The tooling that answers it did not exist until February 2024, three years later.3 Nobody in that thread was confused about their job. The tooling was missing, and a trace file looks close enough to coverage that it kept getting handed over as if it were.
What the real pipeline costs
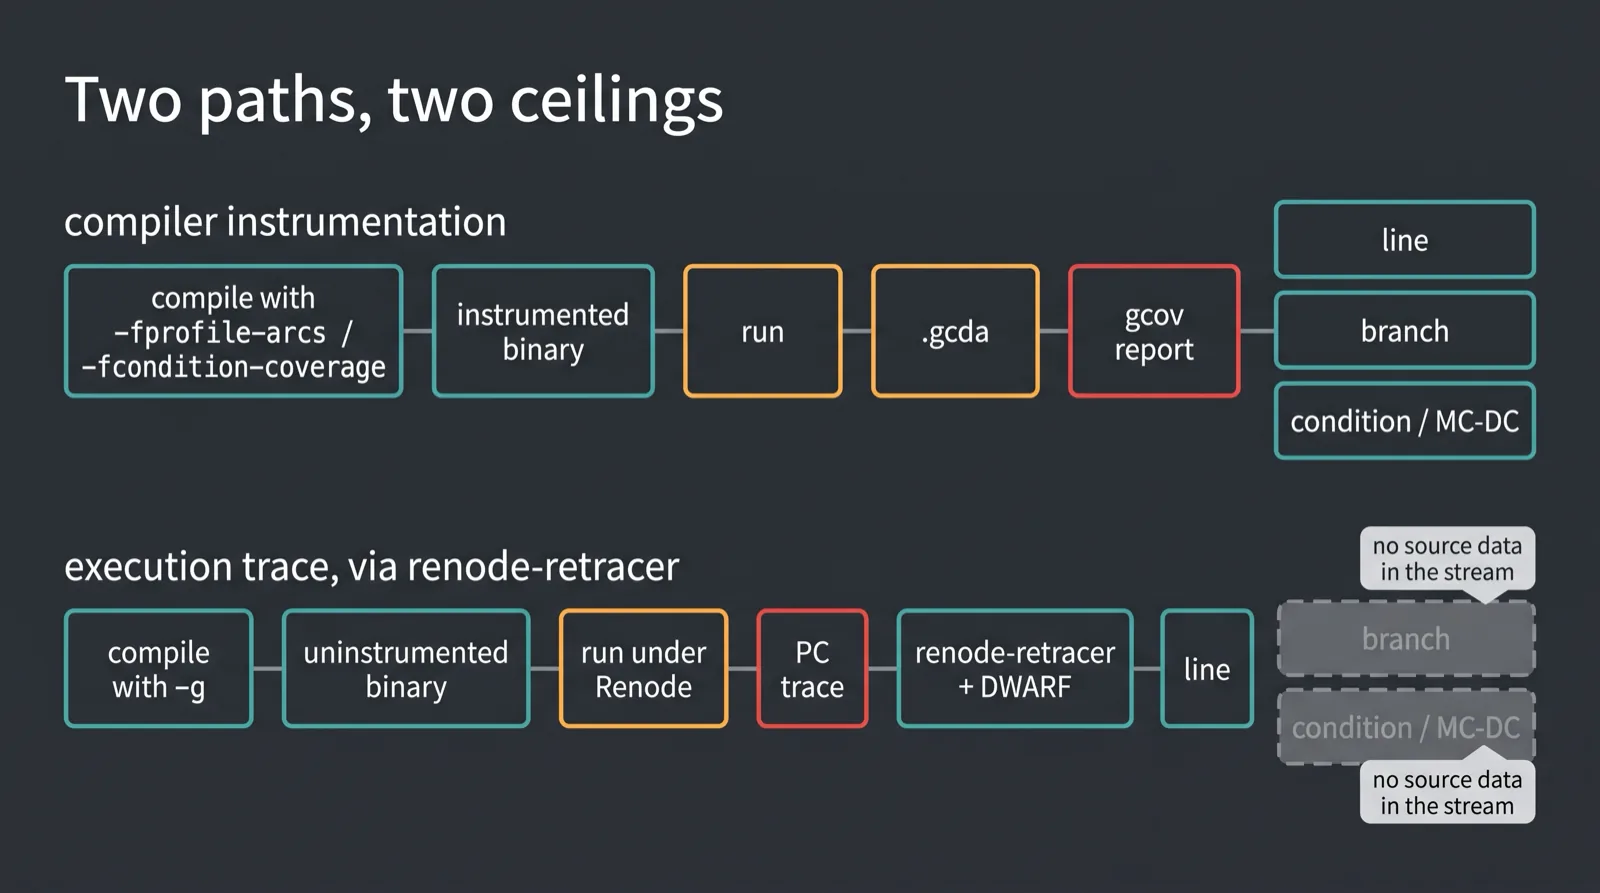
Antmicro built the missing piece and documented it, and the documentation is refreshingly blunt about the preconditions. "With an execution trace of a properly built binary and a dedicated script, you can create a code coverage report."4 Both qualifiers are load-bearing.
The script "combines data in [the DWARF format] (debug information available in ELF files...) with the number of executions of each instruction counted by Renode." DWARF supplies the address-to-source-line mapping. Renode supplies execution counts per address. Neither half is coverage on its own.
Properly built means what you would expect: "it's recommended to use the -g and
-O0 (or -Og) flags... The -g switch adds debug information to the binary,
specifically code line numbers for each machine instruction. The coverage
functionality requires that information, and you will see an error if it's
missing from the ELF file."
And optimization breaks it, stated plainly in the same doc: "Any optimization done by a compiler may prevent redundant lines of code from being executed. The compiler might also replicate the same code line across several addresses in the program or reorder the execution flow, which will make obtaining legitimate results impossible."
The tool is a separate CLI utility, renode-retracer, installed with pipx from
the Renode tree:
renode-retracer coverage trace.bin.gz \
  --binary coverage-sample.elf \
  --sources main.c additional.c \
  --output coverage.zip \
  --export-for-coverview
There is also a fallback for when DWARF is not available: hand the tool a manual
mapping file with --pc2line, lines like 0x800003d8 k210_ops.cpp:252 and
0x80000bb6 main.c:6. That flag is the cleanest proof of the argument. The
address-to-line correspondence is external data fed into the trace. The trace
never carried it.
Antmicro's own writeup says why they took this route rather than the usual one: "The most common method for code coverage analysis has the compiler add additional calls to the coverage infrastructure, meaning the code you're running to get the statistics is not the same as the code you'll be running in production... we leveraged the framework's capabilities to run tests on uninstrumented binaries."3 Their Coverview post repeats the mechanism and names the tradeoff: post-mortem PC-to-line translation "allows you to track line coverage of an executed application without additional instrumentation of the code, which is the typical approach used by tools like gcov."5
Line coverage. That word keeps appearing, and it is not an accident.
I went looking for the branch tag
The docs say "renode-retracer supports generation of line coverage info (DA)".4 That is Antmicro's own sentence and it is the safe thing to quote.
I wanted to know whether the implementation was narrower than the docs, so I read the tool's source. The entire LCOV emission path is one function:
def to_lcov_format(self) -> str:
    return f"DA:{self.number},{self.most_executions()}"
That is the whole thing, at commit 091eb1a of the Renode tree.6 DA is
LCOV's line-hit-count tag. renode-retracer emits no BRDA records, so its
LCOV output contains no branch data. No FNDA, so not even function-hit
records. No condition or MC/DC tag, because LCOV's format has nothing for it and
the tool has nothing to put
there. This is my reading of their source rather than a claim they made, but the
ceiling is not a roadmap item. It is a line number and a count.
Three different ceilings
The reason is not that nobody wrote the feature. It is that the information does not exist in the artifact, not entirely, and not in the same way for every coverage kind.
Branch coverage is not hopeless from a PC stream. A tool with the binary's full
control-flow graph can compare consecutive addresses and infer some
taken/not-taken outcomes, which is close to what Ozone does inside its own
engine. renode-retracer does not do that: to_lcov_format emits DA and
nothing else, so branch is a tooling gap here, not a law of physics. Condition
coverage and MC/DC are the harder wall, because no amount of PC-stream analysis
recovers a boolean expression's term structure. That has to come from the
compiler.
Look at how gcov gets branch data. --coverage is a synonym for -fprofile-arcs -ftest-coverage at compile time plus -lgcov at link.7 -ftest-coverage
emits a .gcno notes file holding the static flow-graph structure, generated
while compiling. -fprofile-arcs adds code: "for each function of your program
GCC creates a program flow graph, then finds a spanning tree for the graph. Only
arcs that are not on the spanning tree have to be instrumented: the compiler adds
code to count the number of times that these arcs are executed." Those counters
write a .gcda at program exit.
Two files, two different times, both produced by the compiler. Neither is a byproduct of running an uninstrumented binary under any external tracer. The graph structure that makes an arc count mean something is a compile-time artifact.
Condition coverage needs a third flag on top of that: -fcondition-coverage,
which adds "code so that program conditions are instrumented. During execution
the program records what terms in a conditional contribute to a decision," read
back with gcov --conditions.8 GCC documents this as masking MC/DC directly,
with the independence rule stated as "an outcome is considered covered if it has
an independent effect on the decision." Output looks like condition outcomes covered 1/4 and condition 0 not covered (true) for a line if (total != 45 && v == 1). Path coverage is yet another flag, -fpath-coverage. The pattern holds
at every rung: line, arc, condition, path, each one its own compile-time switch.
LLVM makes the point even harder to argue with. Clang's source-based coverage
"operates on AST and preprocessor information directly," and MC/DC is
-fcoverage-mcdc layered on -fprofile-instr-generate -fcoverage-mapping.9
Clang's definition ties the criterion to decision structure explicitly: MC/DC is
"the percentage of individual branch conditions that have been shown to
independently affect the decision outcome of the boolean expression they
comprise." The implementation limits give it away completely. Maximum 32767
terms in an expression. Test vectors capped at 2,147,483,646. Those are limits
on boolean-expression syntax, a concept with no representation in an address
stream at all. Clang even ships a second, separate gcov-compatible mode that
operates on DebugInfo instead. One compiler, two structurally different coverage
implementations, and neither of them is "read the PC trace."
If you want the criterion itself rather than the plumbing, that is MC/DC for firmware people. One sentence of lineage: MC/DC is the structural coverage objective at DO-178C Level A, which is why it shows up in embedded conversations at all.
The honest version of the claim
I am not saying trace-derived coverage is a scam. Commercial hardware-trace tooling sells it. SEGGER's page for Ozone with J-Trace says exactly that: "Ozone's trace capability can provide accurate information about instruction execution on the target system. This allows a full code coverage analysis of the firmware."10
That is a real product doing real work, and it does not contradict anything above. Ozone performs its own address-to-source mapping and its own analysis of decision structure inside the debugger. The work still happens. It just happens somewhere you do not have to invoke it yourself. Nobody is claiming the raw trace file is the coverage report.
So the precise claim is this. A trace file is not coverage. Every route from a
trace to coverage adds a mapping and analysis step, and that step lives in one of
three places: a separate script, a debugger's internal engine, or the compiler.
Where it lives sets your ceiling. Machine-level branch outcomes can be inferred
from a PC stream plus a reconstructed control-flow graph. renode-retracer
just does not do that. Source-level condition coverage and MC/DC are a harder
wall: they need the compiler to have known about the decision structure before
the binary was built, which no amount of post-hoc PC analysis recovers.
The practical version: if you are pointing at a trace file as coverage evidence,
check what produced it and what tag it emits. If your build has -O2 in it, the
line mapping is already suspect by the tool's own documentation. And if somebody
tells you an emulator gave them MC/DC, ask which flag was on the compile line.
There is exactly one right answer and a trace does not have it. Same reflex as
what cycle-accurate actually means:
the word is doing more work than the tool is.
Sources
Footnotes
-
Renode documentation, "Execution tracing in Renode." Mode list, per-mode output examples, and the
CreateExecutionTracing/DisableExecutionTracingsyntax. https://renode.readthedocs.io/en/latest/execution-tracing/execution-tracing.html ↩ -
Renode issue #266, "Test with renode and code coverage report," opened 2021-11-18, closed and later reopened with the unanswered LCOV question. https://github.com/renode/renode/issues/266 ↩
-
Antmicro, "Introducing code coverage reporting in Renode," 2024-02-27. Rationale for uninstrumented binaries and the custom trace-to-coverage tool. https://renode.io/news/introducing-code-coverage-reporting-in-renode/ ↩ ↩2
-
Renode documentation, "Generating a coverage report." DWARF join, the
-gand-O0/-Ogbuild requirement, the optimization warning,renode-retracerinvocation,--pc2linefallback, and "line coverage info (DA)". https://renode.readthedocs.io/en/latest/execution-tracing/coverage-report.html ↩ ↩2 -
Antmicro, "Renode integration with Coverview for improved code coverage analysis," 2025-06-17. Post-mortem PC-to-line translation, contrasted with gcov. https://antmicro.com/blog/2025/06/renode-integration-with-coverview ↩
-
renode-retracersource,tools/execution_tracer/execution_tracer/coverage.py, at commit091eb1aca70127a5508573b3f452fdf40eca2ce9. Theto_lcov_formatmethod emitsDAonly; the absence ofBRDA,FNDAand any condition tag is my own reading of the codebase, not an Antmicro statement. https://github.com/renode/renode/blob/091eb1aca70127a5508573b3f452fdf40eca2ce9/tools/execution_tracer/execution_tracer/coverage.py#L67 ↩ -
GCC Online Documentation, "Program Instrumentation Options."
--coverage,-fprofile-arcs,-ftest-coverage,-fcondition-coverage,-fpath-coverage, and the spanning-tree arc instrumentation mechanism. https://gcc.gnu.org/onlinedocs/gcc/Instrumentation-Options.html ↩ -
GCC Online Documentation, "Invoking Gcov."
gcov --conditionsoutput format and the masking MC/DC independence rule. https://gcc.gnu.org/onlinedocs/gcc/Invoking-Gcov.html ↩ -
Clang documentation, "Source-based Code Coverage." AST-based operation, the separate DebugInfo-based gcov mode,
-fcoverage-mcdc, the MC/DC definition, and the term and test-vector limits. https://clang.llvm.org/docs/SourceBasedCodeCoverage.html ↩ -
SEGGER, "Code Coverage" for Ozone with J-Trace. https://www.segger.com/products/development-tools/ozone-j-link-debugger/technology/code-coverage/ ↩