
%20--%3e%3cpath%20d='M2025.4,806.8c-2.5,20.1-16.2,38.2-34.5,45.1-3.4,1.3-8.4,2.3-14.6,3.2-14.2,1.9-34.3,2.8-53.7,2.7h-.2c-23.1-.1-45.1-1.7-54.4-4.4-2.5-.7-4.9-1.6-7.2-2.7-.2,0-.3-.2-.5-.2-8.2-3.8-15.6-9.8-21.1-17.1-5.7-7.6-9.4-16.8-10-27,0,0,0,0,0,0-.5-3.1-.8-6.3-1.1-9.7-.5-7.2-.9-16.4-1-26.5h281.9c0-63.9-2.2-130.2-61.1-167.8-37.4-23.8-95.6-24.8-152.9-22.2-52.8,2.3-90.5,17.6-115.3,46.6-24.2,28.3-35.5,68.9-34.5,125.8h0c.2,12.6,1,26,2.4,40.2.3,3.1.6,6.2,1,9.4,2.9,25.9,12.9,50.3,28.9,70.4,10.9,13.8,24,24.9,38.8,32.8,7.6,4.1,15.7,7.4,24.1,9.8,17.8,5,52.5,7.8,87.8,7.8s64.2-2.2,84.5-7.1c2.9-.7,5.5-1.4,7.8-2.2,45-15,82.5-60.5,85.6-106.7h-80.6ZM2025.3,709.9h-198.3v-2.6c0-33.2,26.7-58.2,64.8-58.2h72.8c30.3,0,60.8,24.9,60.8,58.2v2.6Z'/%3e%3cpath%20d='M1620.8,806.8c-2.5,20.1-16.2,38.2-34.5,45.1-3.4,1.3-8.4,2.3-14.6,3.2-14.2,1.9-34.3,2.8-53.7,2.7h-.2c-23.1-.1-45.1-1.7-54.4-4.4-2.5-.7-4.9-1.6-7.2-2.7-.2,0-.3-.2-.5-.2-8.2-3.8-15.6-9.8-21.1-17.1-5.7-7.6-9.4-16.8-10-27,0,0,0,0,0,0-.5-3.1-.8-6.3-1.1-9.7-.5-7.2-.9-16.4-1-26.5h281.9c0-63.9-2.2-130.2-61.1-167.8-37.4-23.8-95.6-24.8-152.9-22.2-52.8,2.3-90.5,17.6-115.3,46.6-24.2,28.3-35.5,68.9-34.5,125.8h0c.2,12.6,1,26,2.4,40.2.3,3.1.6,6.2,1,9.4,2.9,25.9,12.9,50.3,28.9,70.4,10.9,13.8,24,24.9,38.8,32.8,7.6,4.1,15.7,7.4,24.1,9.8,17.8,5,52.5,7.8,87.8,7.8s64.2-2.2,84.5-7.1c2.9-.7,5.5-1.4,7.8-2.2,45-15,82.5-60.5,85.6-106.7h-80.6ZM1620.8,709.9h-198.3v-2.6c0-33.2,26.7-58.2,64.8-58.2h72.8c30.3,0,60.8,24.9,60.8,58.2v2.6Z'/%3e%3cpath%20d='M2968.1,806.8c-2.5,20.1-16.2,38.2-34.5,45.1-3.4,1.3-8.4,2.3-14.6,3.2-14.2,1.9-34.3,2.8-53.7,2.7h-.2c-23.1-.1-45.1-1.7-54.4-4.4-2.5-.7-4.9-1.6-7.2-2.7-.2,0-.3-.2-.5-.2-8.2-3.8-15.6-9.8-21.1-17.1-5.7-7.6-9.4-16.8-10-27,0,0,0,0,0,0-.5-3.1-.8-6.3-1.1-9.7-.5-7.2-.9-16.4-1-26.5h281.9c0-63.9-2.2-130.2-61.1-167.8-37.4-23.8-95.6-24.8-152.9-22.2-52.8,2.3-90.5,17.6-115.3,46.6-24.2,28.3-35.5,68.9-34.5,125.8h0c.2,12.6,1,26,2.4,40.2.3,3.1.6,6.2,1,9.4,2.9,25.9,12.9,50.3,28.9,70.4,10.9,13.8,24,24.9,38.8,32.8,7.6,4.1,15.7,7.4,24.1,9.8,17.8,5,52.5,7.8,87.8,7.8s64.2-2.2,84.5-7.1c2.9-.7,5.5-1.4,7.8-2.2,45-15,82.5-60.5,85.6-106.7h-80.6ZM2968,709.9h-198.3v-2.6c0-33.2,26.7-58.2,64.8-58.2h72.8c30.3,0,60.8,24.9,60.8,58.2v2.6Z'/%3e%3cpath%20d='M2402,586.8c-33.3-9.5-98.1-9.6-133.7-3.3-28.1,4.9-55.3,19.7-76.7,41.5-21.4,21.8-35.7,49.3-40.3,77.5-10.8,65.9,0,123.9,30.3,163.2,24.8,32.1,61.3,50.7,108.4,55.2,14.2,1.3,27.5,2,40.1,2,30.6,0,56.9-4,79.6-12,39.8-14,69.4-40,86-79.2,8.9-20.9,11.3-36.7,11.3-59.5v-1h-78.2s1.1,63.5-43.7,75.9c-26.4,6.3-75.2,4-98.6,2.3-17.8-1.3-31.6-7.1-41-17.3-9-9.8-14.2-24-15.4-42.1-1.9-28.8-2.6-90.3,7.3-109.2,7.1-13.5,21.4-23.8,37.3-27,23-4.5,98.1-4.2,117.7,3.4,37.1,14.4,36.3,55.9,36.3,55.9h78.2v-2c0-26.6-10.5-55.1-31.4-78.7-19.5-21.9-47-37.8-73.7-45.4Z'/%3e%3crect%20x='2557.8'%20y='492.7'%20width='80.1'%20height='422.1'/%3e%3cpolygon%20points='1119.3%20831.5%201007.4%20585.6%20913.1%20585.6%201065%20913.6%201065.5%20914.8%201173%20914.8%201325.4%20585.6%201231.2%20585.6%201119.3%20831.5'/%3e%3cpolygon%20points='265%20601.6%20265%20810.4%20627.6%201019.1%20627.6%201019.1%20627.6%201019.1%20627.6%201019.1%20627.6%201019.1%20808.9%20914.8%20808.9%20706%20627.6%20810.4%20265%20601.6'/%3e%3cpolygon%20points='808.9%20706%20808.9%20497.2%20627.6%20601.5%20808.9%20706'/%3e%3c/svg%3e)
RTT vs SWO vs UART: choose the constraint, not the tutorial

Ask an engineer why their firmware prints over UART and you usually get a shrug. Ask a coding agent and you get the same answer with more confidence, because the last example in its context window used it.
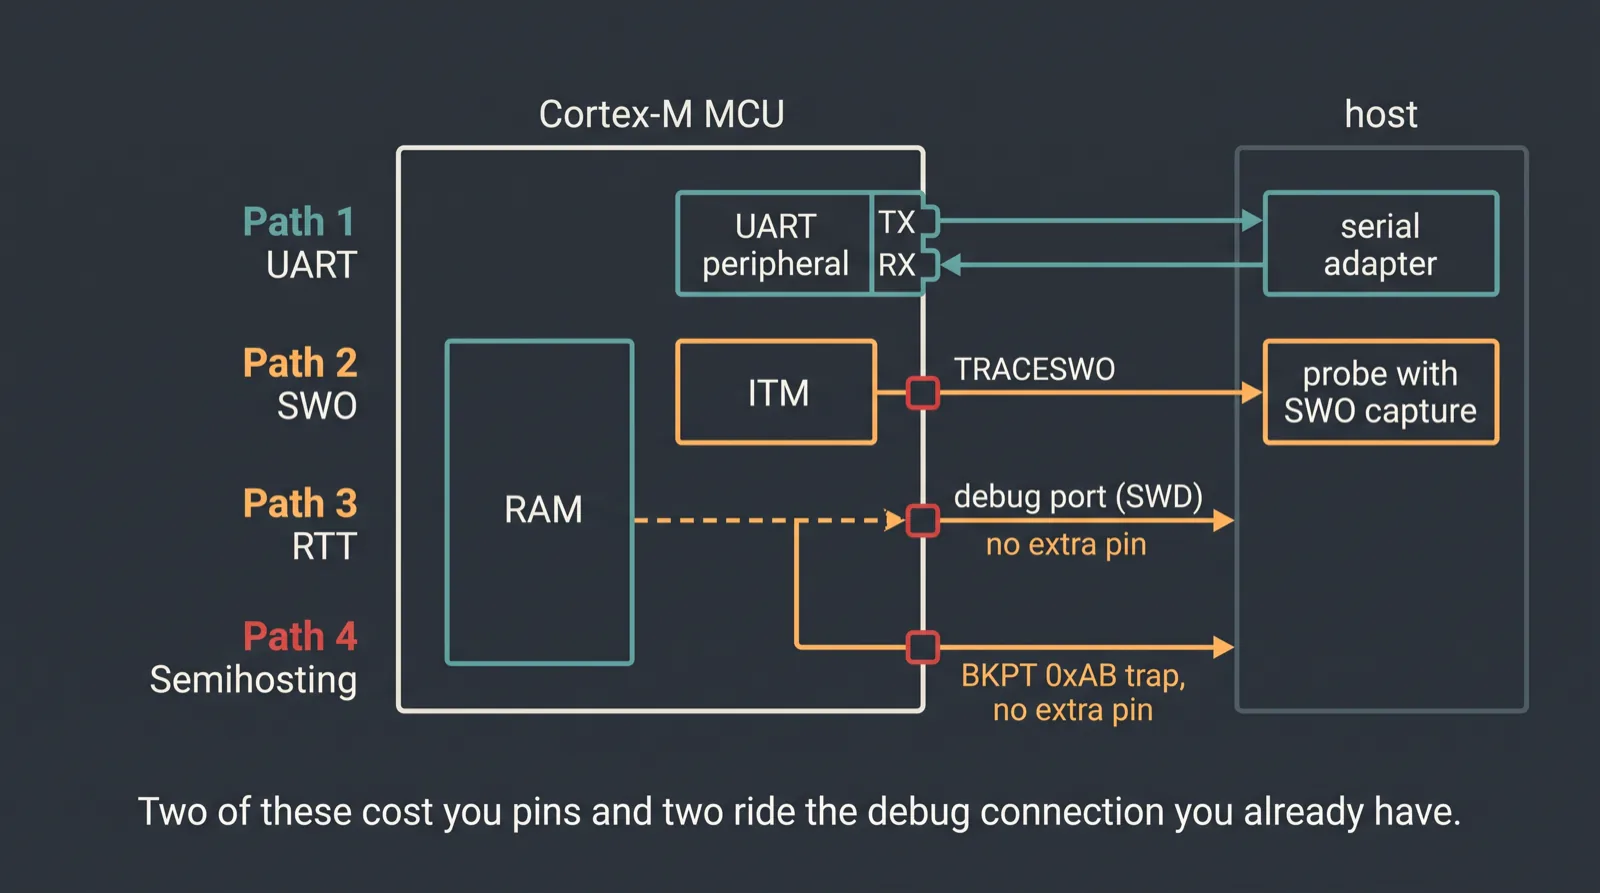
Four common Cortex-M debug-output paths are UART, RTT, SWO, and semihosting, and they are not variations on a theme. One stops your program on every message. One needs a pin that vendor eval kits fail to route even when the probe and the core both support it. One needs no pin at all and reads your RAM while the core runs. One is fully specified as a protocol and completely unowned as debug infrastructure.
Choosing without knowing which is which is how you debug a timing bug through a transport that changes the timing.
The table
| halts the CPU? | bandwidth | hardware needed | extra pin? | under emulation | |
|---|---|---|---|---|---|
| UART | no | baud rate | a free UART peripheral, plus a serial adapter | yes, TX (and RX for input) | yes |
| SEGGER RTT | depends on mode | up to ~3.5 MB/s | debug probe with background memory access | no | needs a host-side reader |
| SWO / ITM | no | prescaler off the core clock; ~1.5 µs/char at 10 MHz | probe with SWO capture, and a core that has it | yes, TRACESWO | only if the sink is modeled |
| Semihosting | yes, every call | milliseconds to >100 ms per message | a debug agent, nothing else | no | yes, by design |
Every row has a caveat that matters more than the row itself.
RTT has three modes and only one of them is free
RTT puts a control block in target RAM. The host probe locates it by scanning for
an ID string, then reads and writes ring buffers, one per channel.1 Your
firmware's write is a memcpy. That is the whole target-side cost.
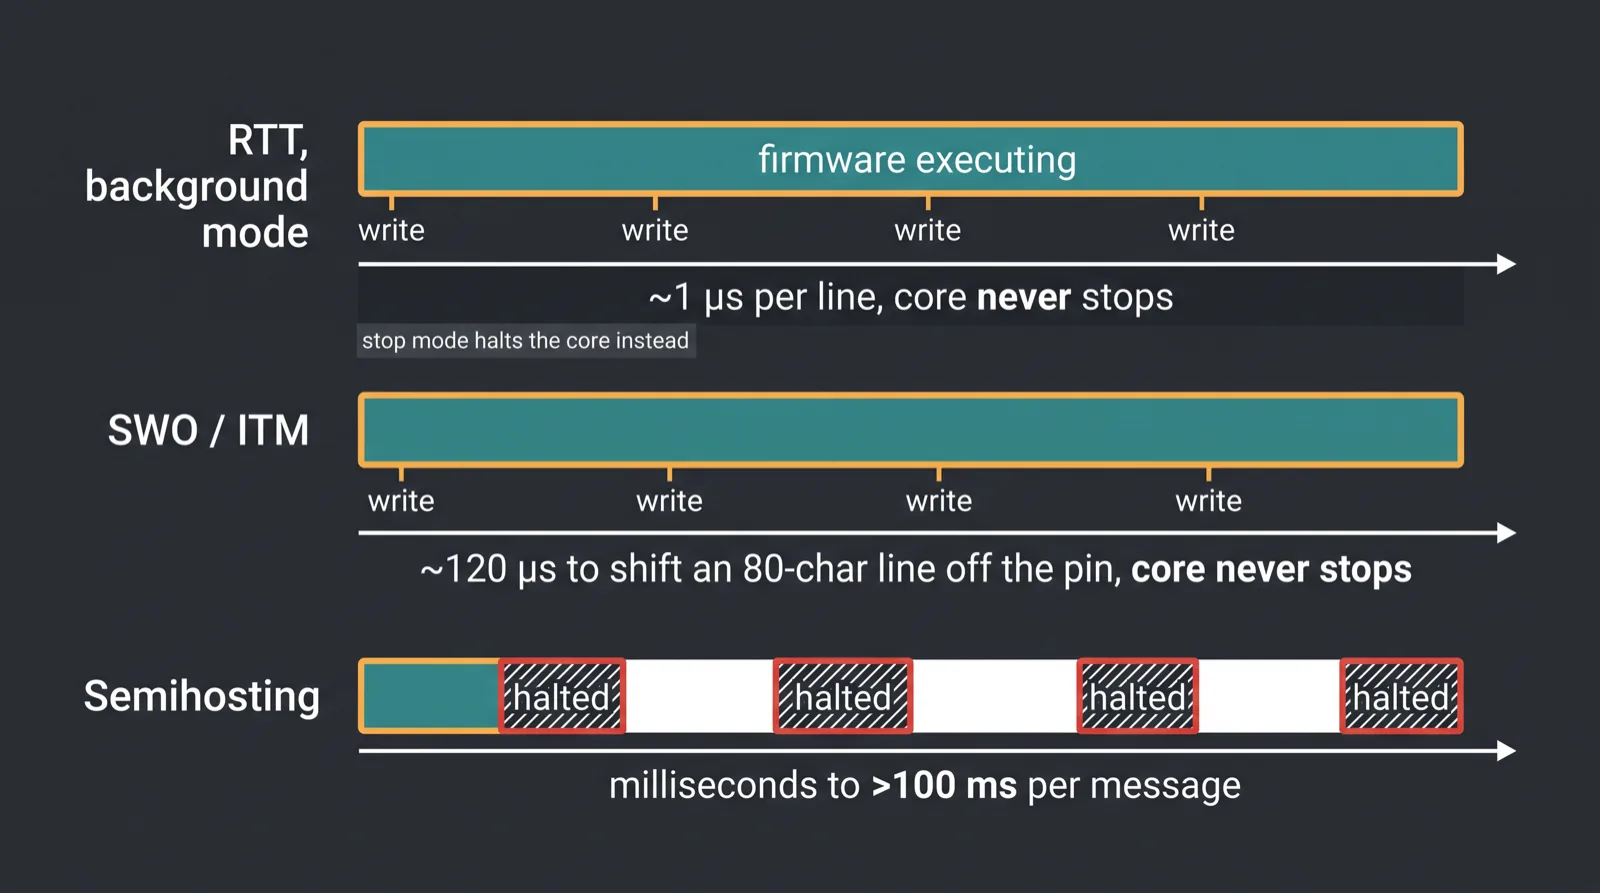
Every summary flattens this: RTT runs in one of three modes. Background mode is the fast one, up to about 3.5 MB/s, available on all current J-Link and J-Trace Pro models. Legacy background mode is the same idea at lower speed on older probe firmware. Stop mode is what SEGGER calls "Pseudo RTT mode": the CPU is halted to read data, and SEGGER documents that it was introduced for CPUs that do not support background access, and that it affects real-time behavior.2
So "RTT never halts the core" holds right up until your part cannot do background memory access, at which point RTT halts the core and you have bought semihosting with extra steps. Throughput scales with the probe, not just the buffer: SEGGER's own numbers put Background mode up to roughly 3.5 MB/s, with Legacy background mode lower on older probe firmware.2 On an STM32F407 at 168 MHz, a line of output costs about a microsecond or less.3
And no extra pin. SEGGER is explicit: RTT needs no additional pin or hardware beyond a probe on the standard debug port.1
"You need a J-Link" is true of the tooling, not of the protocol
SEGGER states the requirement as any J-Link plus any supported target that allows background memory access.1 That describes SEGGER's stack.
It is not a description of the protocol, which is a documented RAM ring-buffer format that three independent projects have reimplemented against CMSIS-DAP-class probes:
- OpenOCD ships
rtt setup address size [ID],rtt start, andrtt server start port channel, over any adapter OpenOCD supports.4 - pyOCD added RTT and SystemView support with a first-class session option,
-O rtt=....56 - probe-rs ships RTT support directly in its
rttmodule now. The standaloneprobe-rs-rttcrate was folded back into the main repo.7
Practical version: with a J-Link, use SEGGER's stack. With an ST-Link on a dev board, RTT is still on the table, not with SEGGER's tools or support.
SWO is gated in three separate places
Serial Wire Output is Arm-architected infrastructure, not a bolt-on. Arm describes
it as a trace sink similar to the TPIU that can trace exactly one source, the ITM,
and outputs the stream off-chip through a single-pin interface; SWO plus its 8-bit
ATB slave interface to the ITM are collectively the Serial Wire Viewer.8
Physically it is ten-bit packets with start and stop bits, in Manchester or UART
encoding, and the capture device is expected to clock at the same speed as the
TRACESWO pin.9 Arm's tooling docs name the use case: ITM stimulus ports exist
for printf-style debugging without a communication interface like a UART.10
Bandwidth is a prescaler off the core clock. TPIU_ACPR sets the divisor for the
SWO baud rate.11 You are not choosing a speed, you are choosing a division of
whatever the core runs at, so a clock change moves your trace port with it. The
concrete cost, from SEGGER's measurements on that same STM32F407: roughly 1.5 µs
per character at 10 MHz, about 120 µs for an eighty-character line.3 Two orders
of magnitude slower per line than RTT.
Then the three gates. Your probe has to support SWO capture, which Arm's own CMSIS-DAP specification treats as optional: separate capability bits report SWO UART, SWO Manchester, and SWO streaming trace.12 Your silicon has to support it, and pyOCD says the quiet part plainly: Armv7-M and Armv8-M Mainline support SWO, while Armv6-M and Armv8-M Baseline do not, so Cortex-M0, M0+, M1 and M23 are out.13 And the board has to have routed the signal to the debug header, which pyOCD notes fails in a surprising number of cases, including on silicon vendor evaluation kits where probe and MCU both support it.13
Three independent things have to be true. A tutorial that worked for its author tells you nothing about whether they are true for you.
Semihosting stops the program, and that is the whole story
Semihosting is a trap. On M-profile Thumb the instruction is BKPT #0xAB, opcode
0xBEAB; A64 uses HLT #0xF000, and A32 can use either SVC #0x123456 or
HLT #0xF000.14 The operation number goes in a register, and the set is a small
POSIX-shaped file API: SYS_OPEN (0x01), SYS_WRITEC (0x03), SYS_WRITE0 (0x04),
SYS_WRITE (0x05), SYS_READ (0x06), SYS_READC (0x07), up through
SYS_EXIT_EXTENDED (0x20).14
SEGGER's description of the mechanism is the clearest one I have found: the target CPU is halted, the debug agent takes control and performs the action, then restarts the target, and the target stays halted for the duration of the operation.15 The price tag is in the same vendor's measurements: one message can take several milliseconds to more than a hundred.3
A hundred milliseconds of stopped core inside a control loop is not logging, it is a fault injection experiment you did not mean to run.
What semihosting buys you is that it needs nothing. No pin, no peripheral, no trace unit, no capture-capable probe. And it works under emulation: Zephyr documents it as a mechanism for code on Arm, RISC-V and Xtensa targets to use the host's I/O facilities under a debugger or an emulator.16
Nobody owns UART, so nobody writes the fourth column
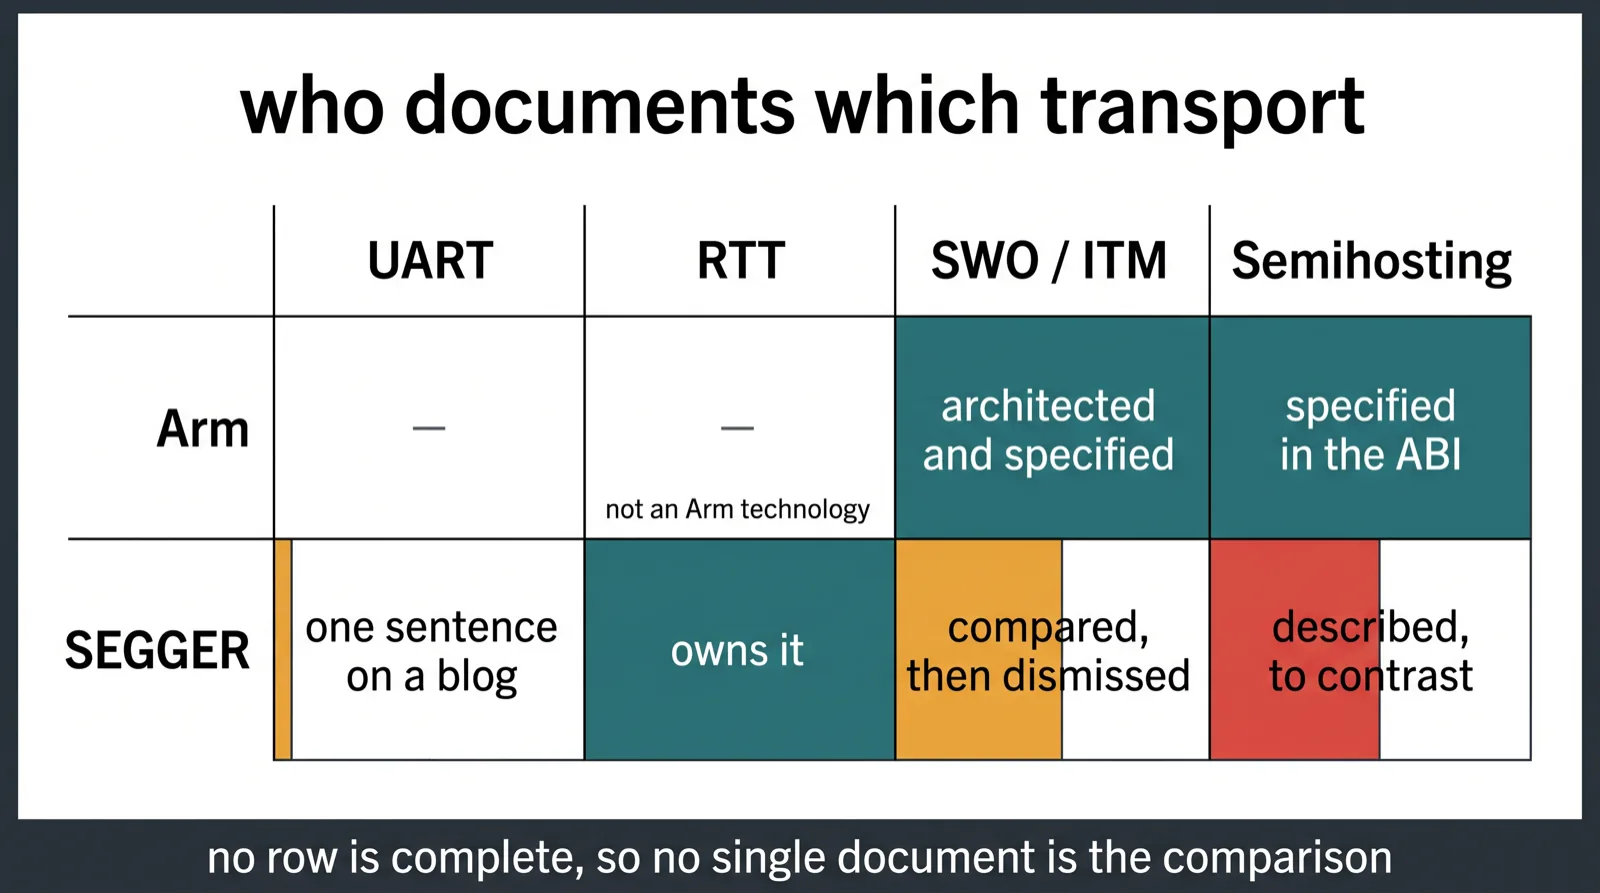
Here is the finding I care about most. I went looking for the document that compares these four. The closest thing I found is a SEGGER blog post, and it naturally favors RTT.
Arm documents SWO, ITM, the TPIU and semihosting thoroughly, because Arm architected all of them. Arm's documentation never mentions RTT and never will: RTT is SEGGER's technology, not part of the architecture. Arm could not produce a four-way matrix even in principle.
SEGGER can, and their blog post on getting printf output off a target is the
closest thing that exists: UART and CDC, semihosting, SWO and RTT in one
place.3 It is also SEGGER's blog, and it concludes that there is no reason to
use SWO anymore when you can use RTT instead. UART gets a single sentence, which
does at least name the real tradeoff: a UART may already be used by the
application, and USB CDC requires a stack and a connector on the target.3 One
dismissive sentence is not a comparison row.
That is the structural problem. Each vendor documents the transport it owns.
Nobody owns UART. It is a convention, not architected debug infrastructure, so
there is no single Cortex-M debug-output specification or vendor responsible
column. You can watch a project work around the pin contention instead: Zephyr's
GDB stub docs tell you to point zephyr,gdbstub-uart at a spare UART so printk
and log messages do not collide with GDB, and say that on boards with one UART you
must disable printk and logging entirely.17 That is the fourth column, written
down as a workaround in someone else's feature docs.
The matrix is scattered by construction. Which is why engineers and agents default to whatever the last tutorial used. They are not being lazy. They went looking for the comparison, found four vendor pages each arguing for its own transport, and copied the example instead.
The emulation column changes the ranking
Delete the board and the ordering inverts. Semihosting, the worst transport on hardware, becomes one of the easiest to get working, because a trap handled by a debug agent is a trap handled by an emulator.16 UART stays available, since a UART peripheral is one of the first things any machine model implements. SWO depends on whether the ITM and its trace sink were modeled at all.
RTT is the interesting one. The target side works fine under emulation, since it is just RAM. What disappears is the host-side reader polling that control block while the core runs. I wrote up that transport's format story separately in the RTOS trace post, including what came back when I ran Zephyr's CTF trace over UART on a simulated board.
Which is why UART still wins more often than it should on paper. It is the only one of the four with no probe requirement, no silicon requirement, no capability bit and no vendor.
Pick on the constraint, not on the example
Four questions, in order. Does the transport get to stop my core? Do I have a pin to spare? Do I have a probe with the right capability, and does my part have the peripheral at all? Am I running this on a model, on silicon, or both?
Answer those and the choice is usually forced. Semihosting for bring-up and for simulated CI where nothing has a deadline. SWO when you have a v7-M or v8-M Mainline part, a routed pin and a capable probe. RTT when you have background access and need throughput. UART when you want the thing that works everywhere.
None of that is hard. It is never written down in one place, so a choice with real timing consequences gets made by whichever page came up first. Simulation moves the tradeoffs around, and there is a separate list of things it still cannot catch, but it does not remove them. It changes which column you read.
Sources
Footnotes
-
SEGGER, "About Real Time Transfer." https://www.segger.com/products/debug-probes/j-link/technology/about-real-time-transfer/ ↩ ↩2 ↩3
-
SEGGER Knowledge Base, "RTT," §RTT operation Modes and buffer/speed figures. https://kb.segger.com/RTT ↩ ↩2
-
SEGGER Blog, Johannes Lask, "Getting printf Output from Target to Debugger," 2016-10-21, updated 2022-10-14. https://blog.segger.com/getting-printf-output-from-target-to-debugger/ ↩ ↩2 ↩3 ↩4 ↩5
-
OpenOCD User's Guide, §15.6 "Real Time Transfer (RTT)." https://openocd.org/doc/html/General-Commands.html ↩
-
pyOCD documentation, "Session options" (
rttoption). https://pyocd.io/docs/options.html ↩ -
pyOCD v0.43.0 release notes, "Add support for SEGGER's RTT and SystemView." https://github.com/pyocd/pyOCD/releases/tag/v0.43.0 ↩
-
probe-rs,rttmodule documentation, "Host side implementation of the RTT (Real-Time Transfer) I/O protocol over probe-rs". The standaloneprobe-rs-rttcrate now redirects here. https://docs.rs/probe-rs/latest/probe_rs/rtt/index.html ↩ -
Arm, CoreSight Technology System Design Guide (DGI0012), §Trace sinks. https://developer.arm.com/documentation/dgi0012/d/CoreSight-Components-and-Systems/CoreSight-components/Trace-sinks ↩
-
Arm, CoreSight Components Technical Reference Manual (DDI0314H), §Serial Wire Output, physical pin protocol. https://developer.arm.com/documentation/ddi0314/h/Serial-Wire-Output/SWO-trace-port/Physical-pin-protocol ↩
-
Arm, µVision User's Guide (101407), "Trace Features." https://developer.arm.com/documentation/101407/latest/Debugging/Code-and-Data-Trace--Cortex-M-/Trace-Features ↩
-
Armv7-M Architecture Reference Manual (DDI0403E), §C1.10 Trace Port Interface Unit:
TPIU_ACPRis the SWO baud-rate prescaler. https://developer.arm.com/documentation/ddi0403/latest ↩ -
Arm, CMSIS-DAP
DAP_Infocapabilities and SWO commands. https://arm-software.github.io/CMSIS-DAP/latest/group__DAP__Info.html and https://arm-software.github.io/CMSIS-DAP/latest/group__DAP__swo__gr.html ↩ -
pyOCD documentation, "SWO/SWV" (probe, MCU, architecture and board routing requirements). https://pyocd.io/docs/swo_swv.html ↩ ↩2
-
Arm, ABI for the Arm Architecture,
semihosting.rst(trap instructions and operation numbers). https://github.com/ARM-software/abi-aa/blob/main/semihosting/semihosting.rst ↩ ↩2 -
SEGGER Knowledge Base, "Semihosting" (SEGGER's description of the halt-and-resume mechanism). https://kb.segger.com/Semihosting ↩
-
Zephyr documentation, "Semihosting Guide." https://docs.zephyrproject.org/latest/hardware/arch/semihost.html ↩ ↩2
-
Zephyr documentation, "GDB stub" (
zephyr,gdbstub-uartand single-UART boards). https://docs.zephyrproject.org/latest/services/debugging/gdbstub.html ↩