%20--%3e%3cpath%20d='M2025.4,806.8c-2.5,20.1-16.2,38.2-34.5,45.1-3.4,1.3-8.4,2.3-14.6,3.2-14.2,1.9-34.3,2.8-53.7,2.7h-.2c-23.1-.1-45.1-1.7-54.4-4.4-2.5-.7-4.9-1.6-7.2-2.7-.2,0-.3-.2-.5-.2-8.2-3.8-15.6-9.8-21.1-17.1-5.7-7.6-9.4-16.8-10-27,0,0,0,0,0,0-.5-3.1-.8-6.3-1.1-9.7-.5-7.2-.9-16.4-1-26.5h281.9c0-63.9-2.2-130.2-61.1-167.8-37.4-23.8-95.6-24.8-152.9-22.2-52.8,2.3-90.5,17.6-115.3,46.6-24.2,28.3-35.5,68.9-34.5,125.8h0c.2,12.6,1,26,2.4,40.2.3,3.1.6,6.2,1,9.4,2.9,25.9,12.9,50.3,28.9,70.4,10.9,13.8,24,24.9,38.8,32.8,7.6,4.1,15.7,7.4,24.1,9.8,17.8,5,52.5,7.8,87.8,7.8s64.2-2.2,84.5-7.1c2.9-.7,5.5-1.4,7.8-2.2,45-15,82.5-60.5,85.6-106.7h-80.6ZM2025.3,709.9h-198.3v-2.6c0-33.2,26.7-58.2,64.8-58.2h72.8c30.3,0,60.8,24.9,60.8,58.2v2.6Z'/%3e%3cpath%20d='M1620.8,806.8c-2.5,20.1-16.2,38.2-34.5,45.1-3.4,1.3-8.4,2.3-14.6,3.2-14.2,1.9-34.3,2.8-53.7,2.7h-.2c-23.1-.1-45.1-1.7-54.4-4.4-2.5-.7-4.9-1.6-7.2-2.7-.2,0-.3-.2-.5-.2-8.2-3.8-15.6-9.8-21.1-17.1-5.7-7.6-9.4-16.8-10-27,0,0,0,0,0,0-.5-3.1-.8-6.3-1.1-9.7-.5-7.2-.9-16.4-1-26.5h281.9c0-63.9-2.2-130.2-61.1-167.8-37.4-23.8-95.6-24.8-152.9-22.2-52.8,2.3-90.5,17.6-115.3,46.6-24.2,28.3-35.5,68.9-34.5,125.8h0c.2,12.6,1,26,2.4,40.2.3,3.1.6,6.2,1,9.4,2.9,25.9,12.9,50.3,28.9,70.4,10.9,13.8,24,24.9,38.8,32.8,7.6,4.1,15.7,7.4,24.1,9.8,17.8,5,52.5,7.8,87.8,7.8s64.2-2.2,84.5-7.1c2.9-.7,5.5-1.4,7.8-2.2,45-15,82.5-60.5,85.6-106.7h-80.6ZM1620.8,709.9h-198.3v-2.6c0-33.2,26.7-58.2,64.8-58.2h72.8c30.3,0,60.8,24.9,60.8,58.2v2.6Z'/%3e%3cpath%20d='M2968.1,806.8c-2.5,20.1-16.2,38.2-34.5,45.1-3.4,1.3-8.4,2.3-14.6,3.2-14.2,1.9-34.3,2.8-53.7,2.7h-.2c-23.1-.1-45.1-1.7-54.4-4.4-2.5-.7-4.9-1.6-7.2-2.7-.2,0-.3-.2-.5-.2-8.2-3.8-15.6-9.8-21.1-17.1-5.7-7.6-9.4-16.8-10-27,0,0,0,0,0,0-.5-3.1-.8-6.3-1.1-9.7-.5-7.2-.9-16.4-1-26.5h281.9c0-63.9-2.2-130.2-61.1-167.8-37.4-23.8-95.6-24.8-152.9-22.2-52.8,2.3-90.5,17.6-115.3,46.6-24.2,28.3-35.5,68.9-34.5,125.8h0c.2,12.6,1,26,2.4,40.2.3,3.1.6,6.2,1,9.4,2.9,25.9,12.9,50.3,28.9,70.4,10.9,13.8,24,24.9,38.8,32.8,7.6,4.1,15.7,7.4,24.1,9.8,17.8,5,52.5,7.8,87.8,7.8s64.2-2.2,84.5-7.1c2.9-.7,5.5-1.4,7.8-2.2,45-15,82.5-60.5,85.6-106.7h-80.6ZM2968,709.9h-198.3v-2.6c0-33.2,26.7-58.2,64.8-58.2h72.8c30.3,0,60.8,24.9,60.8,58.2v2.6Z'/%3e%3cpath%20d='M2402,586.8c-33.3-9.5-98.1-9.6-133.7-3.3-28.1,4.9-55.3,19.7-76.7,41.5-21.4,21.8-35.7,49.3-40.3,77.5-10.8,65.9,0,123.9,30.3,163.2,24.8,32.1,61.3,50.7,108.4,55.2,14.2,1.3,27.5,2,40.1,2,30.6,0,56.9-4,79.6-12,39.8-14,69.4-40,86-79.2,8.9-20.9,11.3-36.7,11.3-59.5v-1h-78.2s1.1,63.5-43.7,75.9c-26.4,6.3-75.2,4-98.6,2.3-17.8-1.3-31.6-7.1-41-17.3-9-9.8-14.2-24-15.4-42.1-1.9-28.8-2.6-90.3,7.3-109.2,7.1-13.5,21.4-23.8,37.3-27,23-4.5,98.1-4.2,117.7,3.4,37.1,14.4,36.3,55.9,36.3,55.9h78.2v-2c0-26.6-10.5-55.1-31.4-78.7-19.5-21.9-47-37.8-73.7-45.4Z'/%3e%3crect%20x='2557.8'%20y='492.7'%20width='80.1'%20height='422.1'/%3e%3cpolygon%20points='1119.3%20831.5%201007.4%20585.6%20913.1%20585.6%201065%20913.6%201065.5%20914.8%201173%20914.8%201325.4%20585.6%201231.2%20585.6%201119.3%20831.5'/%3e%3cpolygon%20points='265%20601.6%20265%20810.4%20627.6%201019.1%20627.6%201019.1%20627.6%201019.1%20627.6%201019.1%20627.6%201019.1%20808.9%20914.8%20808.9%20706%20627.6%20810.4%20265%20601.6'/%3e%3cpolygon%20points='808.9%20706%20808.9%20497.2%20627.6%20601.5%20808.9%20706'/%3e%3c/svg%3e)
Why UART is still the best debug interface in 2026
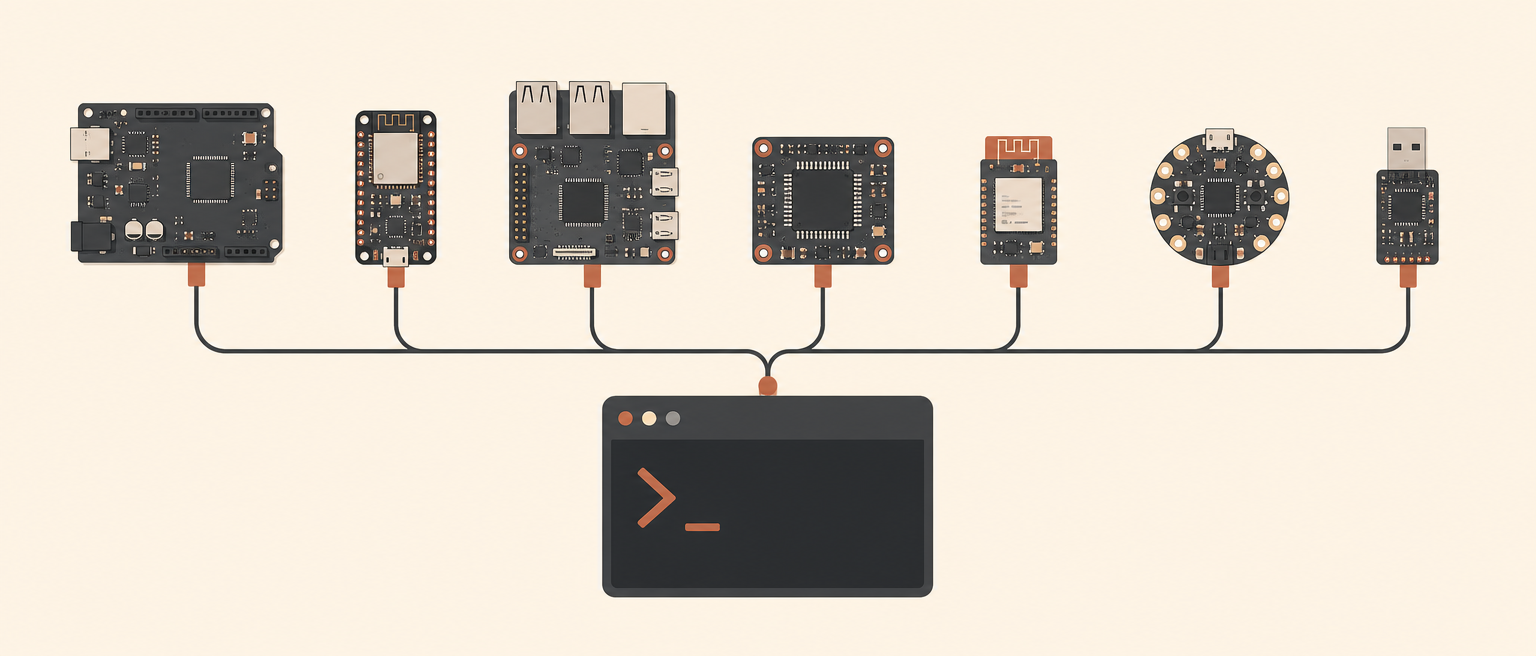
I have a coding agent that reads a datasheet, writes a peripheral driver, builds it, and runs it on a virtual chip without touching hardware. Very modern. Very 2026.
The way it finds out whether any of that worked is a serial port whose design predates the microcontroller.
Nobody planned this. The UART debug interface won by outliving everything that was supposed to replace it, and it keeps winning for a reason that has nothing to do with nostalgia.
A very short history of watching firmware
Debug interfaces have gone through roughly four generations.
First there were lights. Front-panel LEDs and switches, and the debugging technique was "blink the LED in a pattern I can count." People still do this. It's the only interface guaranteed to work when nothing else does.
Then serial. A device to shift bytes out one wire and in on another, so a machine could talk to a teletype. The acronym is older than the chips we run it on. Firmware borrowed it immediately, because a print statement is the cheapest debugging tool ever invented and it worked here too.
Then the dedicated debug port. JTAG arrived as an IEEE standard at the start of the nineties, built for boundary scan and quickly repurposed into halt-the-core, read-the-registers debugging. ARM later squeezed it down to two pins as SWD, which is what your probe is actually speaking today.
Then trace. SWO, ITM, ETM. Real instrumentation: timestamped events streamed out of the core without stopping it, so you can watch timing instead of guessing at it.
Each generation was strictly more capable than the last. And every single one of them shipped next to a UART, not instead of it.
Why the old one didn't die
Five things, and none of them are features. They're all absences.
It needs two wires. TX, RX, ground. Often you only wire TX, because all you want is for the board to talk. There is no clock line to route, no impedance to worry about, no probe that needs to be within a few inches of the target.
It needs no special tooling. A three dollar USB-serial adapter, or the virtual COM port your debug probe already exposes. Compare that to the software stack between a trace port and a readable timeline.
The output is human-readable with no decoder. printf, and the string comes out the other
end as a string. No symbol table, no map file, no vendor GUI that only runs on Windows. You do
not have to reconstruct meaning; the firmware author already wrote it down.
It has no host-side state. cat /dev/ttyACM0. It's a file. Nothing to attach to, nothing to
lose sync with, nothing that dies when you unplug and replug.
It works when the rest of the chip doesn't. Clock tree half configured, watchdog barking, peripherals unenumerated, no debugger connected. One shift register and a baud clock is a very low bar to clear, so it clears early in boot and keeps clearing it while everything downstream is on fire.
There's a sixth thing that only became load-bearing recently: text goes into a pipe. An agent can't attach to your trace GUI. It can read a line of ASCII and act on it. When we talk about the loop breaking at the machine, the thing that closes it in practice is almost always a serial log.
Seven boards, one afternoon
Here's the claim I get to make that most of what we publish can't: today, UART output was captured on every single board Chiplab supports. Not a representative sample. All seven.
Verbatim, the line each board printed:
STM32F4 Discovery
08:04:34.9793 [INFO] usart2: [...] Hello world!

STM32F7 Discovery
08:09:04.6720 [INFO] usart2: [...] Hello world!

STM32F103 Blue Pill
08:07:06.4365 [INFO] usart1: [...] bluepill-hello: $2 board, zero hardware, still boots

STM32L073 Nucleo
08:07:06.8859 [INFO] usart2: [...] datasheet-agent: never seen this board before, reading DBGMCU_IDCODE

STM32H745 Nucleo
08:09:05.2628 [INFO] usart3: [...] Hello world!

nRF52840 DK
08:09:06.3444 [INFO] uart0: [...] Hello world!

STM32WBA52 Nucleo
08:09:05.9954 [INFO] usart1: [...] Hello world!
And how each run went:
| Board | Peripheral | Clean? |
|---|---|---|
| STM32F4 Discovery | usart2 | Yes, no warnings. FreeRTOS task, repeats periodically |
| STM32F7 Discovery | usart2 | One RCC warning, output unaffected |
| STM32F103 Blue Pill | usart1 | UART clean, GPIO path in the same run was not |
| STM32L073 Nucleo | usart2 | Yes |
| STM32H745 Nucleo | usart3 | Yes, no warnings, dual-core board |
| nRF52840 DK | uart0 | Two PSEL pin-config warnings, output unaffected |
| STM32WBA52 Nucleo | usart1 | Benign RCC/PWR warnings, output unaffected. Embassy async example, prints once per second |
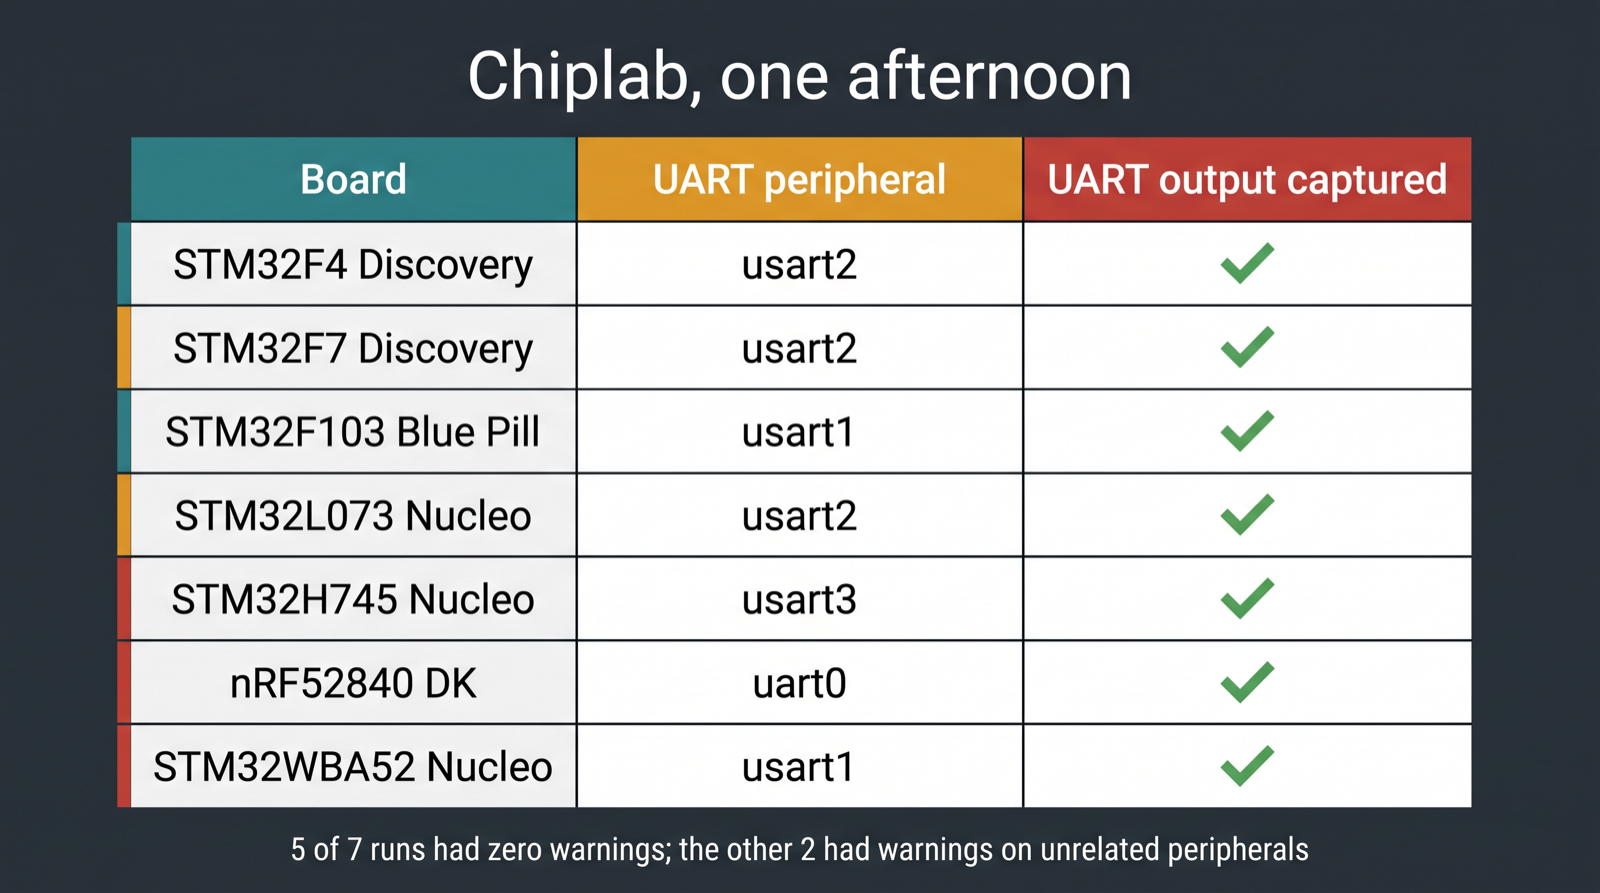
I want to be precise about the two imperfect ones, because "all seven were flawless" would be the more marketable sentence and it isn't true.
On the F7, Chiplab logged [WARNING] rcc: Unhandled read/write from offset 0x90 before the
firmware got going. That's a clock-control register bit the model doesn't track. On the nRF52840
there were two warnings about unhandled PSEL bits. On Nordic parts the PSEL registers select which
physical pins route to the UART peripheral, and our model didn't track two of the reserved bits.
The WBA52, the newest chip in the set, produced a handful of RCC and PWR register warnings.
In all three cases the warnings were about registers next to the UART, not the UART. The output came out anyway.
The Blue Pill run is the most interesting of the seven for exactly this reason. The UART path worked cleanly, while the GPIO path in that same run hit bit-band addresses Chiplab's model doesn't implement. Same firmware, same run, same simulator: serial fine, pin toggling broken. That story gets its own post in Blue Pill in 2026.
Why simulators get UART right first
That pattern isn't luck, and it's the actual argument of this post.
A UART is one shift register and a baud clock. There's no DMA requirement, no handshaking to negotiate, no descriptor rings, no clock-domain trickery you have to model to get a byte out. You can implement a usable one in an afternoon. The behavior a simulator has to reproduce is "bytes appear in order," and bytes appearing in order is not hard.
Now compare that to what's sitting one register block over. A clock tree with a dozen interdependent enables. A pin mux where the reserved bits still do something on this revision. A power controller with modes that change what other peripherals see. That is where our warnings came from, on all three boards.
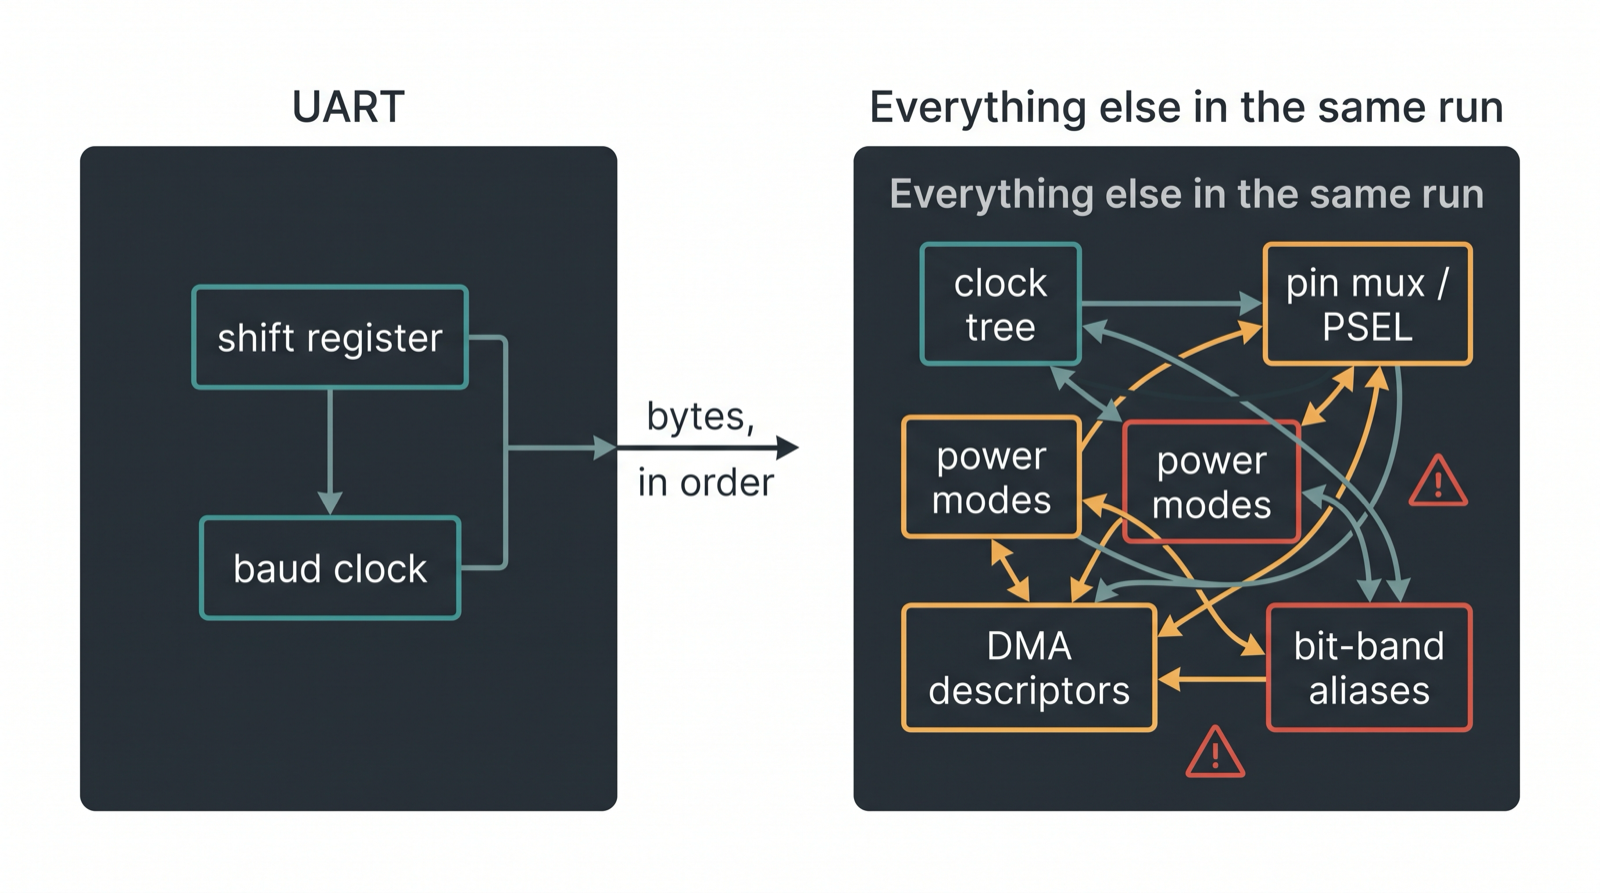
So UART ends up as the lowest common denominator that real silicon and simulators actually agree
on. It's the first peripheral implemented, the first one tested, and the one least likely to have
drifted since. On a new board, printf over serial is the closest thing to a guarantee you get.
That cuts both ways, and I'd rather say it here than let you discover it: agreeing on UART is not the same as agreeing on the chip. What simulation can't catch is a list of the places our stack will hand you a plausible number instead of an error. A clean serial log tells you the firmware reached that print statement. It does not tell you the peripheral underneath it behaves like silicon.
When you actually need more than UART
UART is a debug interface. It is not a debugger. Some things it will never do for you.
Real-time trace. SWO and ITM stream timestamped events out of the core while it keeps running.
A printf at 115200 baud costs real cycles and shifts the timing of the thing you're measuring.
If you're chasing jitter or an interrupt-latency problem, serial logging is part of the problem.
Register-level inspection. JTAG and SWD let you halt the core and read memory and registers as
they are, right now. No breakpoints over UART. No stepping. No "what is in r3 at this moment."
The only state you can see is state the firmware author decided to print, which means you can only
debug problems you already anticipated.
High-bandwidth and timing-critical buses. A logic analyzer on SPI or I2C shows you edges, setup times, and who drove the line low. Serial output shows you what your driver believed happened. Those are different, and when they disagree the logic analyzer is right.
Anything before your UART is initialized. If the fault happens during clock setup, the interface that reports faults isn't up yet. That's what a debug probe is for.
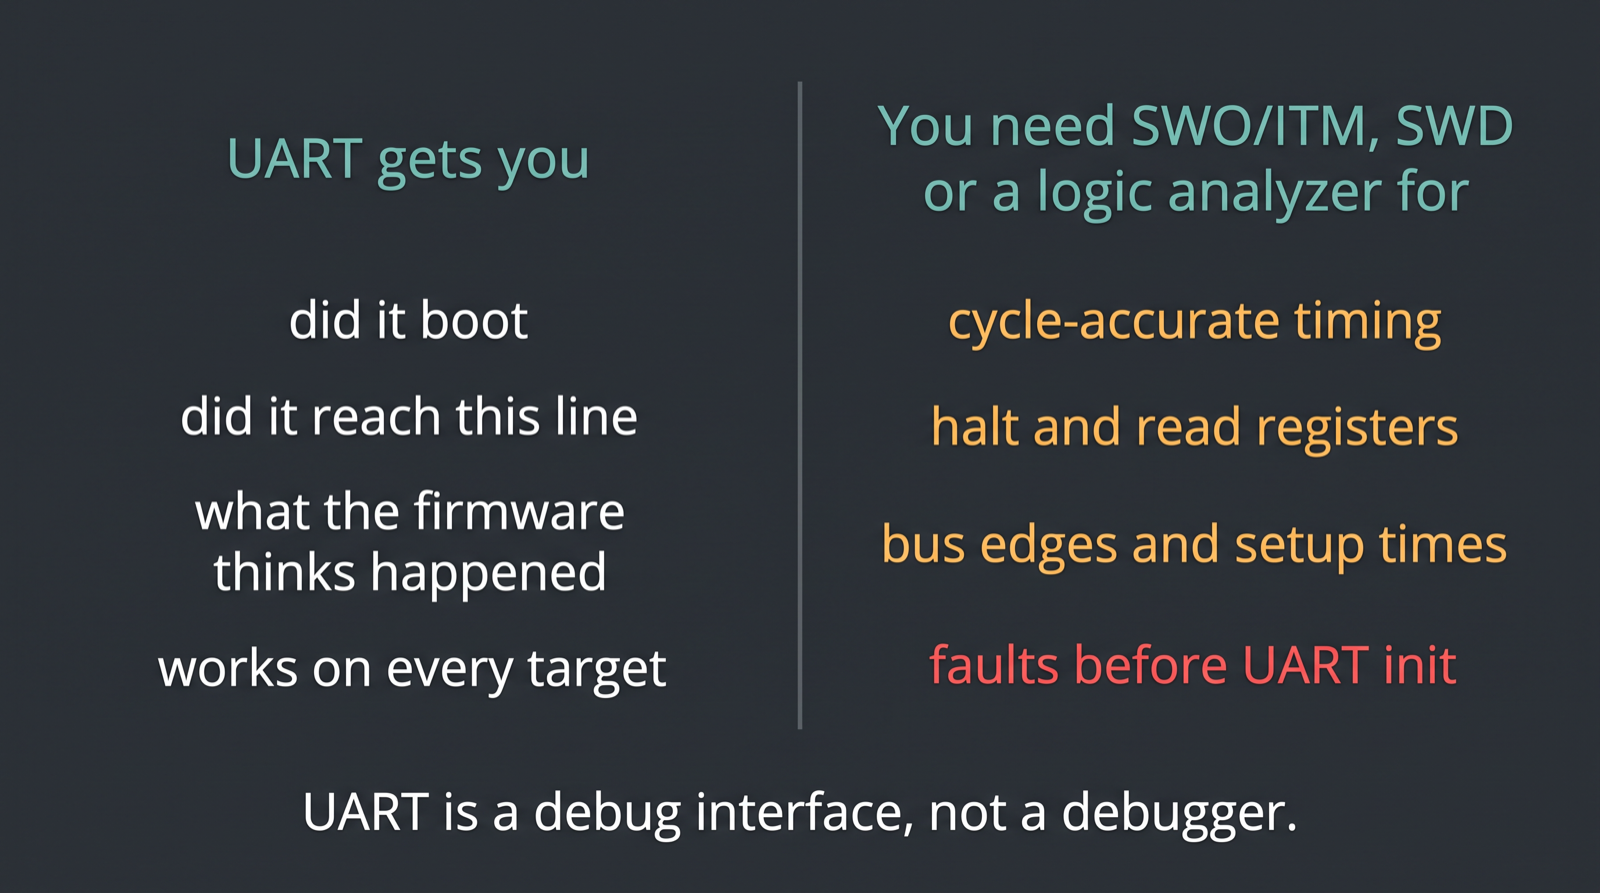
None of that is an argument for skipping serial. It's an argument for knowing what layer you're looking at. Serial answers "did it get here and what did it think." The probe answers "what is actually in the machine." Most bugs die to the first question, which is why the first question is worth making trivially cheap on every target.
The boring conclusion
Two wires and a print statement is still the fastest way to find out whether firmware works, on real silicon and in simulation, and now also for an agent that can only act on what it can read. When we needed a first-run sanity check across seven different chips from two vendors, including a part that came out recently and a dollar-store clone of a part from 2007, we didn't debate the approach. We printed a line.
Every one of those boards had a different clock tree, a different pin mux, and a different level of model maturity behind it. The UART was the only thing they all agreed on. That agreement is the whole value, and it's why the interface everyone predicted would be retired thirty years ago is the one I'd pick first if you gave me an unfamiliar board and an afternoon.
It's also why going from datasheet to running firmware starts with a serial banner and not a debugger session. Get the board talking first. Everything else is easier once it does.